Immigrants from Western Europe vs Immigrants from Nicaragua Child Poverty Under the Age of 5
COMPARE
Immigrants from Western Europe
Immigrants from Nicaragua
Child Poverty Under the Age of 5
Child Poverty Under the Age of 5 Comparison
Immigrants from Western Europe
Immigrants from Nicaragua
16.5%
CHILD POVERTY UNDER THE AGE OF 5
83.3/ 100
METRIC RATING
141st/ 347
METRIC RANK
19.8%
CHILD POVERTY UNDER THE AGE OF 5
0.3/ 100
METRIC RATING
252nd/ 347
METRIC RANK
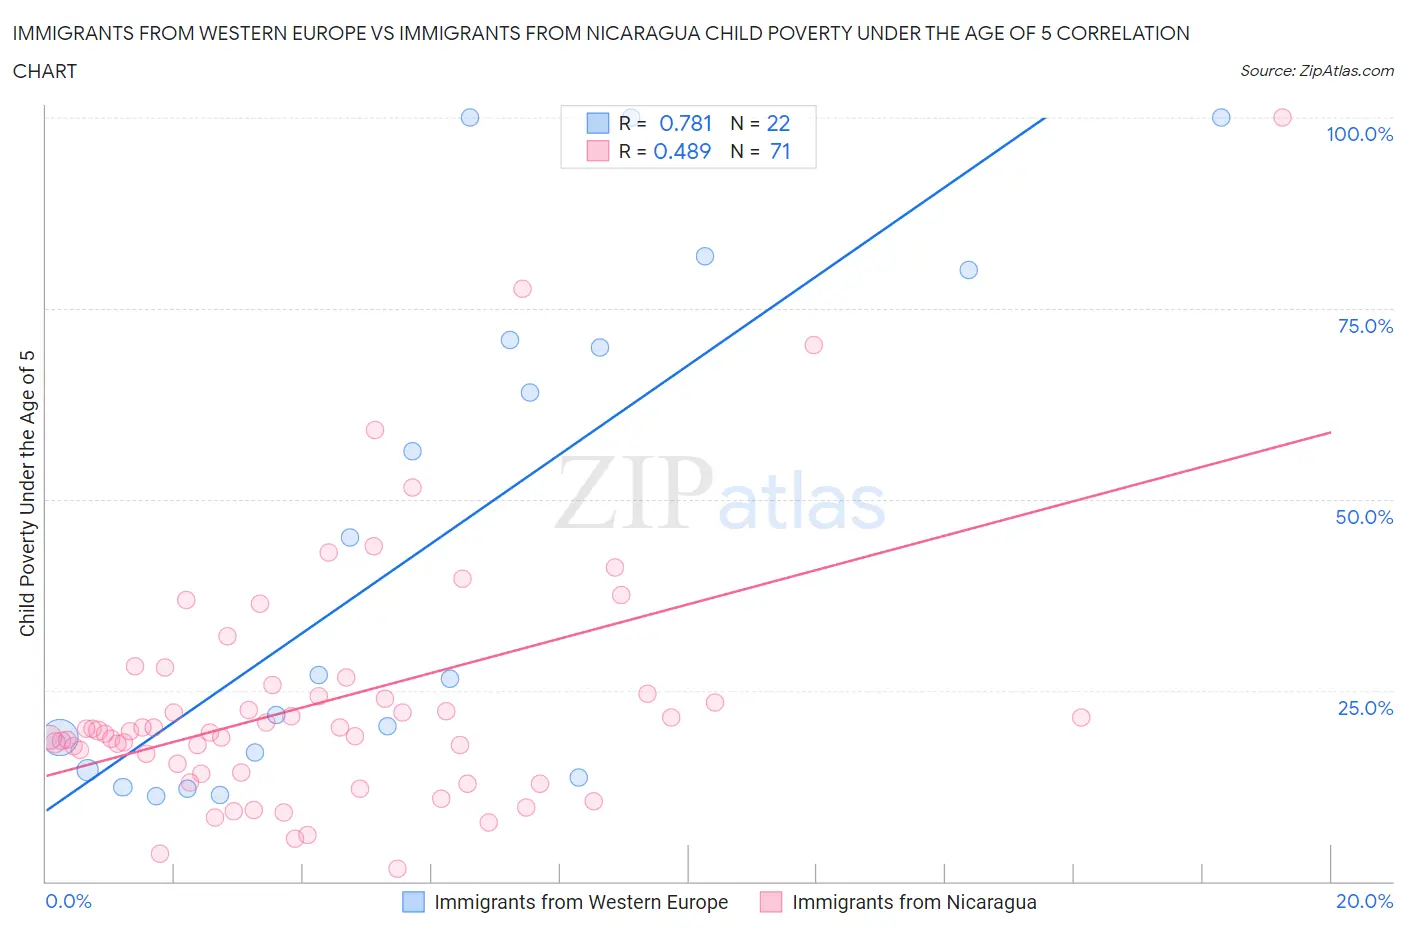
Immigrants from Western Europe vs Immigrants from Nicaragua Child Poverty Under the Age of 5 Correlation Chart
The statistical analysis conducted on geographies consisting of 467,153,267 people shows a strong positive correlation between the proportion of Immigrants from Western Europe and poverty level among children under the age of 5 in the United States with a correlation coefficient (R) of 0.781 and weighted average of 16.5%. Similarly, the statistical analysis conducted on geographies consisting of 232,258,486 people shows a moderate positive correlation between the proportion of Immigrants from Nicaragua and poverty level among children under the age of 5 in the United States with a correlation coefficient (R) of 0.489 and weighted average of 19.8%, a difference of 19.8%.
Child Poverty Under the Age of 5 Correlation Summary
| Measurement | Immigrants from Western Europe | Immigrants from Nicaragua |
| Minimum | 11.1% | 1.7% |
| Maximum | 100.0% | 100.0% |
| Range | 88.9% | 98.3% |
| Mean | 44.3% | 23.5% |
| Median | 26.7% | 19.7% |
| Interquartile 25% (IQ1) | 14.6% | 14.3% |
| Interquartile 75% (IQ3) | 70.8% | 24.5% |
| Interquartile Range (IQR) | 56.3% | 10.2% |
| Standard Deviation (Sample) | 33.1% | 16.7% |
| Standard Deviation (Population) | 32.4% | 16.5% |
Similar Demographics by Child Poverty Under the Age of 5
Demographics Similar to Immigrants from Western Europe by Child Poverty Under the Age of 5
In terms of child poverty under the age of 5, the demographic groups most similar to Immigrants from Western Europe are Portuguese (16.5%, a difference of 0.040%), Samoan (16.5%, a difference of 0.050%), Ethiopian (16.5%, a difference of 0.11%), Guamanian/Chamorro (16.5%, a difference of 0.19%), and Immigrants from Ethiopia (16.6%, a difference of 0.22%).
| Demographics | Rating | Rank | Child Poverty Under the Age of 5 |
| Immigrants | North Macedonia | 87.8 /100 | #134 | Excellent 16.4% |
| Brazilians | 87.8 /100 | #135 | Excellent 16.4% |
| Immigrants | Northern Africa | 87.5 /100 | #136 | Excellent 16.4% |
| Immigrants | Chile | 85.3 /100 | #137 | Excellent 16.4% |
| Germans | 84.8 /100 | #138 | Excellent 16.5% |
| Immigrants | Hungary | 84.5 /100 | #139 | Excellent 16.5% |
| Guamanians/Chamorros | 84.2 /100 | #140 | Excellent 16.5% |
| Immigrants | Western Europe | 83.3 /100 | #141 | Excellent 16.5% |
| Portuguese | 83.0 /100 | #142 | Excellent 16.5% |
| Samoans | 83.0 /100 | #143 | Excellent 16.5% |
| Ethiopians | 82.7 /100 | #144 | Excellent 16.5% |
| Immigrants | Ethiopia | 82.1 /100 | #145 | Excellent 16.6% |
| Israelis | 82.0 /100 | #146 | Excellent 16.6% |
| Immigrants | Nepal | 80.3 /100 | #147 | Excellent 16.6% |
| Syrians | 79.1 /100 | #148 | Good 16.6% |
Demographics Similar to Immigrants from Nicaragua by Child Poverty Under the Age of 5
In terms of child poverty under the age of 5, the demographic groups most similar to Immigrants from Nicaragua are Pennsylvania German (19.8%, a difference of 0.040%), Nonimmigrants (19.7%, a difference of 0.22%), Immigrants from Middle Africa (19.7%, a difference of 0.27%), Marshallese (19.7%, a difference of 0.29%), and Guyanese (19.7%, a difference of 0.30%).
| Demographics | Rating | Rank | Child Poverty Under the Age of 5 |
| Immigrants | Western Africa | 0.4 /100 | #245 | Tragic 19.7% |
| Cree | 0.4 /100 | #246 | Tragic 19.7% |
| Guyanese | 0.4 /100 | #247 | Tragic 19.7% |
| Marshallese | 0.4 /100 | #248 | Tragic 19.7% |
| Immigrants | Middle Africa | 0.4 /100 | #249 | Tragic 19.7% |
| Immigrants | Nonimmigrants | 0.4 /100 | #250 | Tragic 19.7% |
| Pennsylvania Germans | 0.3 /100 | #251 | Tragic 19.8% |
| Immigrants | Nicaragua | 0.3 /100 | #252 | Tragic 19.8% |
| Mexican American Indians | 0.3 /100 | #253 | Tragic 19.9% |
| Fijians | 0.3 /100 | #254 | Tragic 19.9% |
| Immigrants | Cuba | 0.2 /100 | #255 | Tragic 19.9% |
| Immigrants | Barbados | 0.2 /100 | #256 | Tragic 20.0% |
| Shoshone | 0.2 /100 | #257 | Tragic 20.0% |
| Immigrants | St. Vincent and the Grenadines | 0.2 /100 | #258 | Tragic 20.0% |
| Immigrants | El Salvador | 0.2 /100 | #259 | Tragic 20.0% |