Immigrants from Western Europe vs Immigrants from North America Child Poverty Under the Age of 5
COMPARE
Immigrants from Western Europe
Immigrants from North America
Child Poverty Under the Age of 5
Child Poverty Under the Age of 5 Comparison
Immigrants from Western Europe
Immigrants from North America
16.5%
CHILD POVERTY UNDER THE AGE OF 5
83.3/ 100
METRIC RATING
141st/ 347
METRIC RANK
15.9%
CHILD POVERTY UNDER THE AGE OF 5
94.9/ 100
METRIC RATING
104th/ 347
METRIC RANK
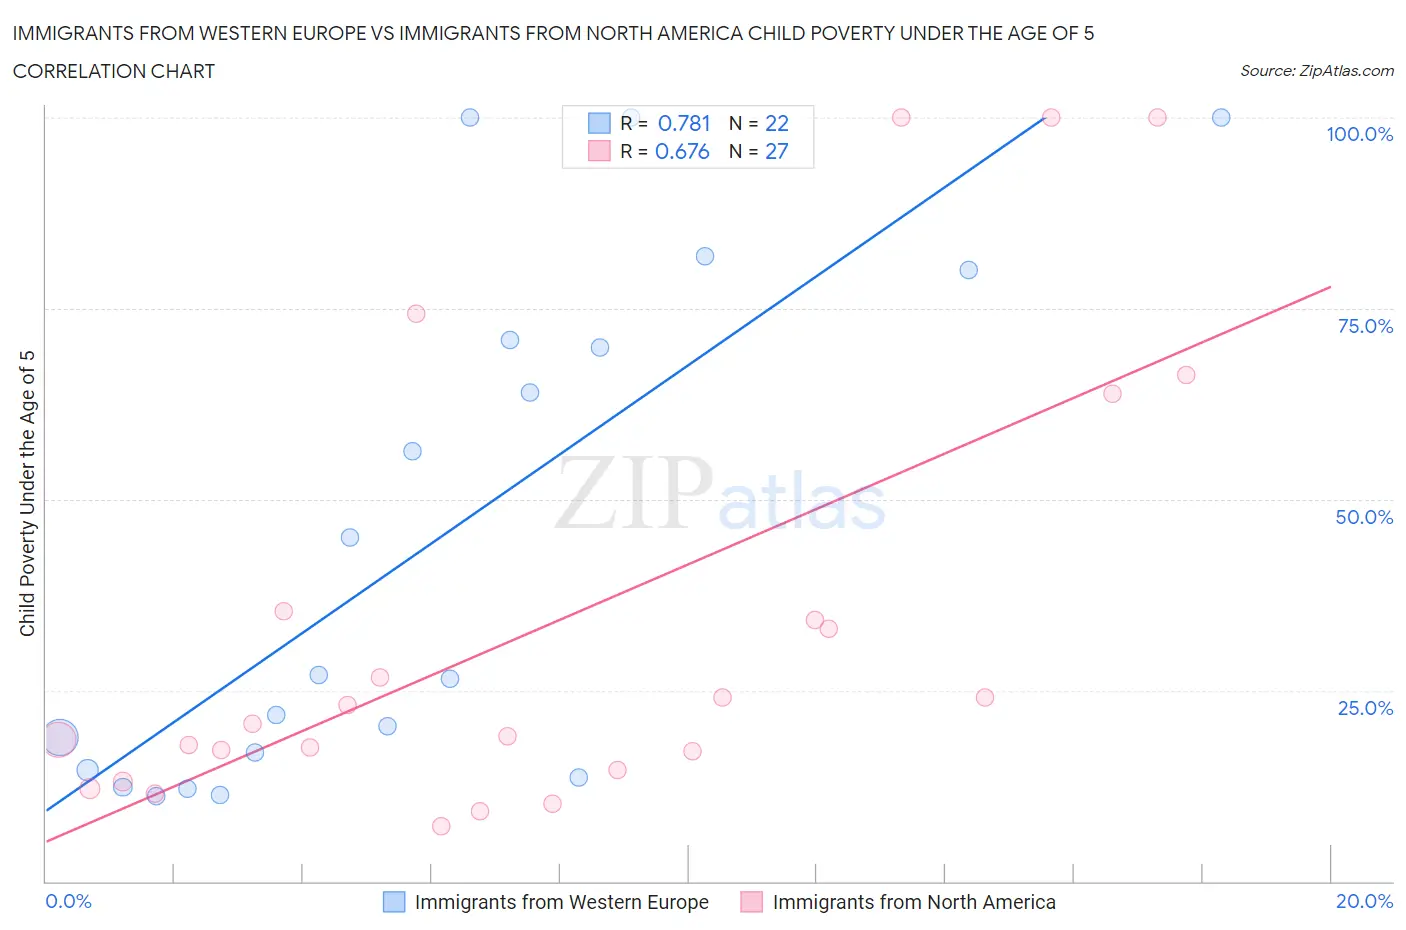
Immigrants from Western Europe vs Immigrants from North America Child Poverty Under the Age of 5 Correlation Chart
The statistical analysis conducted on geographies consisting of 467,153,267 people shows a strong positive correlation between the proportion of Immigrants from Western Europe and poverty level among children under the age of 5 in the United States with a correlation coefficient (R) of 0.781 and weighted average of 16.5%. Similarly, the statistical analysis conducted on geographies consisting of 437,519,892 people shows a significant positive correlation between the proportion of Immigrants from North America and poverty level among children under the age of 5 in the United States with a correlation coefficient (R) of 0.676 and weighted average of 15.9%, a difference of 3.7%.
Child Poverty Under the Age of 5 Correlation Summary
| Measurement | Immigrants from Western Europe | Immigrants from North America |
| Minimum | 11.1% | 7.2% |
| Maximum | 100.0% | 100.0% |
| Range | 88.9% | 92.8% |
| Mean | 44.3% | 33.7% |
| Median | 26.7% | 20.7% |
| Interquartile 25% (IQ1) | 14.6% | 14.6% |
| Interquartile 75% (IQ3) | 70.8% | 35.3% |
| Interquartile Range (IQR) | 56.3% | 20.7% |
| Standard Deviation (Sample) | 33.1% | 29.4% |
| Standard Deviation (Population) | 32.4% | 28.8% |
Similar Demographics by Child Poverty Under the Age of 5
Demographics Similar to Immigrants from Western Europe by Child Poverty Under the Age of 5
In terms of child poverty under the age of 5, the demographic groups most similar to Immigrants from Western Europe are Portuguese (16.5%, a difference of 0.040%), Samoan (16.5%, a difference of 0.050%), Ethiopian (16.5%, a difference of 0.11%), Guamanian/Chamorro (16.5%, a difference of 0.19%), and Immigrants from Ethiopia (16.6%, a difference of 0.22%).
| Demographics | Rating | Rank | Child Poverty Under the Age of 5 |
| Immigrants | North Macedonia | 87.8 /100 | #134 | Excellent 16.4% |
| Brazilians | 87.8 /100 | #135 | Excellent 16.4% |
| Immigrants | Northern Africa | 87.5 /100 | #136 | Excellent 16.4% |
| Immigrants | Chile | 85.3 /100 | #137 | Excellent 16.4% |
| Germans | 84.8 /100 | #138 | Excellent 16.5% |
| Immigrants | Hungary | 84.5 /100 | #139 | Excellent 16.5% |
| Guamanians/Chamorros | 84.2 /100 | #140 | Excellent 16.5% |
| Immigrants | Western Europe | 83.3 /100 | #141 | Excellent 16.5% |
| Portuguese | 83.0 /100 | #142 | Excellent 16.5% |
| Samoans | 83.0 /100 | #143 | Excellent 16.5% |
| Ethiopians | 82.7 /100 | #144 | Excellent 16.5% |
| Immigrants | Ethiopia | 82.1 /100 | #145 | Excellent 16.6% |
| Israelis | 82.0 /100 | #146 | Excellent 16.6% |
| Immigrants | Nepal | 80.3 /100 | #147 | Excellent 16.6% |
| Syrians | 79.1 /100 | #148 | Good 16.6% |
Demographics Similar to Immigrants from North America by Child Poverty Under the Age of 5
In terms of child poverty under the age of 5, the demographic groups most similar to Immigrants from North America are Immigrants from Spain (15.9%, a difference of 0.080%), Tlingit-Haida (15.9%, a difference of 0.12%), European (15.9%, a difference of 0.21%), Slovene (16.0%, a difference of 0.27%), and Immigrants from Brazil (16.0%, a difference of 0.28%).
| Demographics | Rating | Rank | Child Poverty Under the Age of 5 |
| Macedonians | 96.2 /100 | #97 | Exceptional 15.8% |
| Immigrants | South Africa | 96.1 /100 | #98 | Exceptional 15.8% |
| Palestinians | 95.9 /100 | #99 | Exceptional 15.8% |
| Immigrants | Canada | 95.9 /100 | #100 | Exceptional 15.8% |
| Immigrants | Zimbabwe | 95.9 /100 | #101 | Exceptional 15.8% |
| Armenians | 95.7 /100 | #102 | Exceptional 15.8% |
| Europeans | 95.3 /100 | #103 | Exceptional 15.9% |
| Immigrants | North America | 94.9 /100 | #104 | Exceptional 15.9% |
| Immigrants | Spain | 94.8 /100 | #105 | Exceptional 15.9% |
| Tlingit-Haida | 94.7 /100 | #106 | Exceptional 15.9% |
| Slovenes | 94.4 /100 | #107 | Exceptional 16.0% |
| Immigrants | Brazil | 94.4 /100 | #108 | Exceptional 16.0% |
| Northern Europeans | 94.3 /100 | #109 | Exceptional 16.0% |
| Romanians | 94.3 /100 | #110 | Exceptional 16.0% |
| Pakistanis | 94.2 /100 | #111 | Exceptional 16.0% |