Immigrants from Western Europe vs Lumbee Child Poverty Under the Age of 5
COMPARE
Immigrants from Western Europe
Lumbee
Child Poverty Under the Age of 5
Child Poverty Under the Age of 5 Comparison
Immigrants from Western Europe
Lumbee
16.5%
CHILD POVERTY UNDER THE AGE OF 5
83.3/ 100
METRIC RATING
141st/ 347
METRIC RANK
33.3%
CHILD POVERTY UNDER THE AGE OF 5
0.0/ 100
METRIC RATING
346th/ 347
METRIC RANK
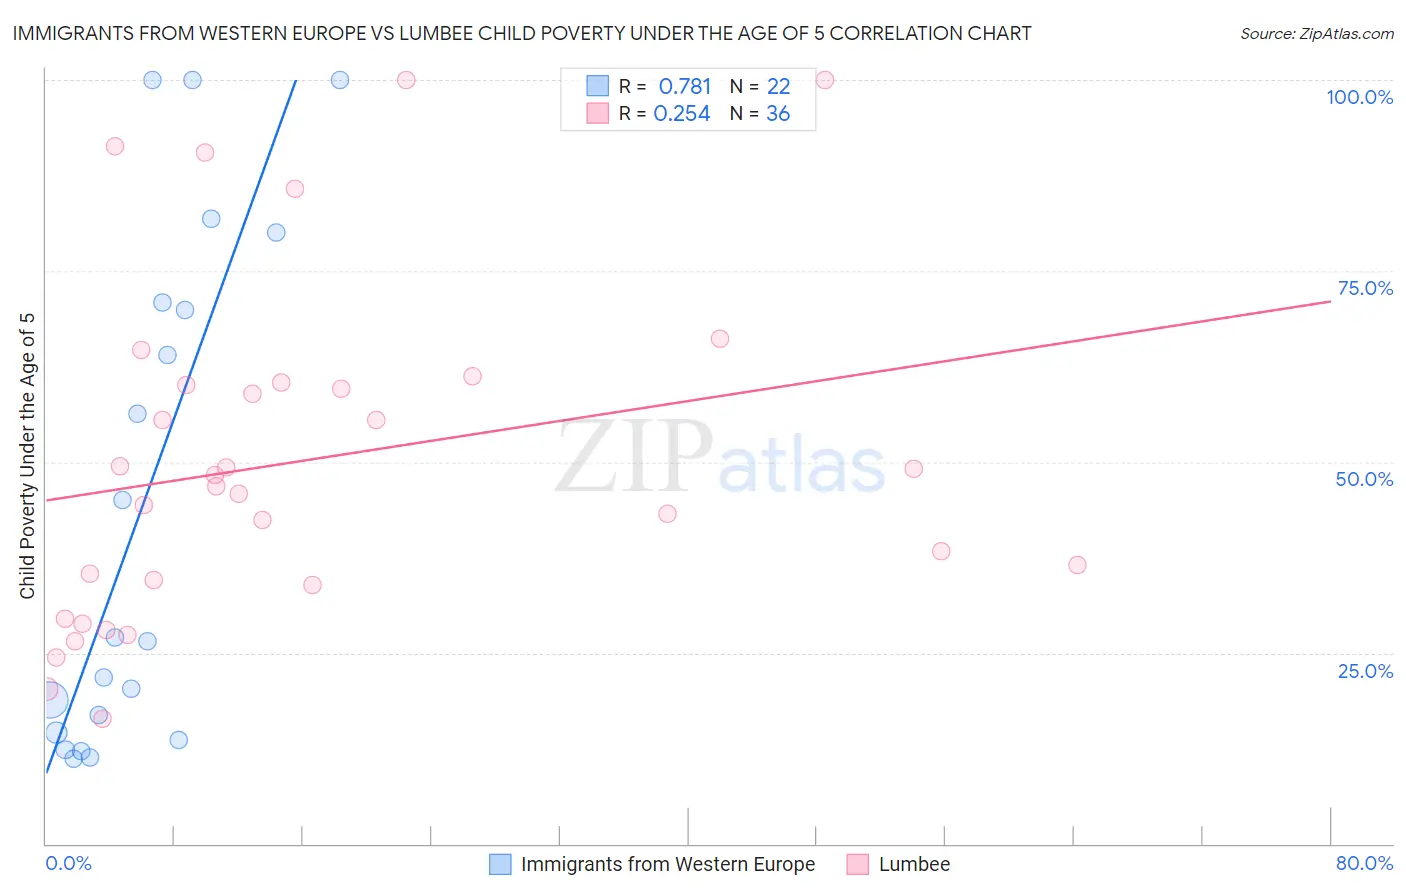
Immigrants from Western Europe vs Lumbee Child Poverty Under the Age of 5 Correlation Chart
The statistical analysis conducted on geographies consisting of 467,153,267 people shows a strong positive correlation between the proportion of Immigrants from Western Europe and poverty level among children under the age of 5 in the United States with a correlation coefficient (R) of 0.781 and weighted average of 16.5%. Similarly, the statistical analysis conducted on geographies consisting of 91,145,286 people shows a weak positive correlation between the proportion of Lumbee and poverty level among children under the age of 5 in the United States with a correlation coefficient (R) of 0.254 and weighted average of 33.3%, a difference of 101.7%.
Child Poverty Under the Age of 5 Correlation Summary
| Measurement | Immigrants from Western Europe | Lumbee |
| Minimum | 11.1% | 16.3% |
| Maximum | 100.0% | 100.0% |
| Range | 88.9% | 83.7% |
| Mean | 44.3% | 50.2% |
| Median | 26.7% | 47.5% |
| Interquartile 25% (IQ1) | 14.6% | 34.2% |
| Interquartile 75% (IQ3) | 70.8% | 60.3% |
| Interquartile Range (IQR) | 56.3% | 26.1% |
| Standard Deviation (Sample) | 33.1% | 22.0% |
| Standard Deviation (Population) | 32.4% | 21.7% |
Similar Demographics by Child Poverty Under the Age of 5
Demographics Similar to Immigrants from Western Europe by Child Poverty Under the Age of 5
In terms of child poverty under the age of 5, the demographic groups most similar to Immigrants from Western Europe are Portuguese (16.5%, a difference of 0.040%), Samoan (16.5%, a difference of 0.050%), Ethiopian (16.5%, a difference of 0.11%), Guamanian/Chamorro (16.5%, a difference of 0.19%), and Immigrants from Ethiopia (16.6%, a difference of 0.22%).
| Demographics | Rating | Rank | Child Poverty Under the Age of 5 |
| Immigrants | North Macedonia | 87.8 /100 | #134 | Excellent 16.4% |
| Brazilians | 87.8 /100 | #135 | Excellent 16.4% |
| Immigrants | Northern Africa | 87.5 /100 | #136 | Excellent 16.4% |
| Immigrants | Chile | 85.3 /100 | #137 | Excellent 16.4% |
| Germans | 84.8 /100 | #138 | Excellent 16.5% |
| Immigrants | Hungary | 84.5 /100 | #139 | Excellent 16.5% |
| Guamanians/Chamorros | 84.2 /100 | #140 | Excellent 16.5% |
| Immigrants | Western Europe | 83.3 /100 | #141 | Excellent 16.5% |
| Portuguese | 83.0 /100 | #142 | Excellent 16.5% |
| Samoans | 83.0 /100 | #143 | Excellent 16.5% |
| Ethiopians | 82.7 /100 | #144 | Excellent 16.5% |
| Immigrants | Ethiopia | 82.1 /100 | #145 | Excellent 16.6% |
| Israelis | 82.0 /100 | #146 | Excellent 16.6% |
| Immigrants | Nepal | 80.3 /100 | #147 | Excellent 16.6% |
| Syrians | 79.1 /100 | #148 | Good 16.6% |
Demographics Similar to Lumbee by Child Poverty Under the Age of 5
In terms of child poverty under the age of 5, the demographic groups most similar to Lumbee are Puerto Rican (34.5%, a difference of 3.7%), Navajo (31.6%, a difference of 5.4%), Crow (31.0%, a difference of 7.4%), Yuman (29.5%, a difference of 12.7%), and Tohono O'odham (29.5%, a difference of 12.9%).
| Demographics | Rating | Rank | Child Poverty Under the Age of 5 |
| Natives/Alaskans | 0.0 /100 | #333 | Tragic 25.6% |
| Blacks/African Americans | 0.0 /100 | #334 | Tragic 25.7% |
| Colville | 0.0 /100 | #335 | Tragic 25.7% |
| Sioux | 0.0 /100 | #336 | Tragic 26.9% |
| Pima | 0.0 /100 | #337 | Tragic 27.4% |
| Hopi | 0.0 /100 | #338 | Tragic 27.7% |
| Yup'ik | 0.0 /100 | #339 | Tragic 27.7% |
| Cheyenne | 0.0 /100 | #340 | Tragic 28.3% |
| Immigrants | Yemen | 0.0 /100 | #341 | Tragic 29.3% |
| Tohono O'odham | 0.0 /100 | #342 | Tragic 29.5% |
| Yuman | 0.0 /100 | #343 | Tragic 29.5% |
| Crow | 0.0 /100 | #344 | Tragic 31.0% |
| Navajo | 0.0 /100 | #345 | Tragic 31.6% |
| Lumbee | 0.0 /100 | #346 | Tragic 33.3% |
| Puerto Ricans | 0.0 /100 | #347 | Tragic 34.5% |