Nicaraguan vs Immigrants from Nicaragua Child Poverty Under the Age of 5
COMPARE
Nicaraguan
Immigrants from Nicaragua
Child Poverty Under the Age of 5
Child Poverty Under the Age of 5 Comparison
Nicaraguans
Immigrants from Nicaragua
19.1%
CHILD POVERTY UNDER THE AGE OF 5
1.6/ 100
METRIC RATING
224th/ 347
METRIC RANK
19.8%
CHILD POVERTY UNDER THE AGE OF 5
0.3/ 100
METRIC RATING
252nd/ 347
METRIC RANK
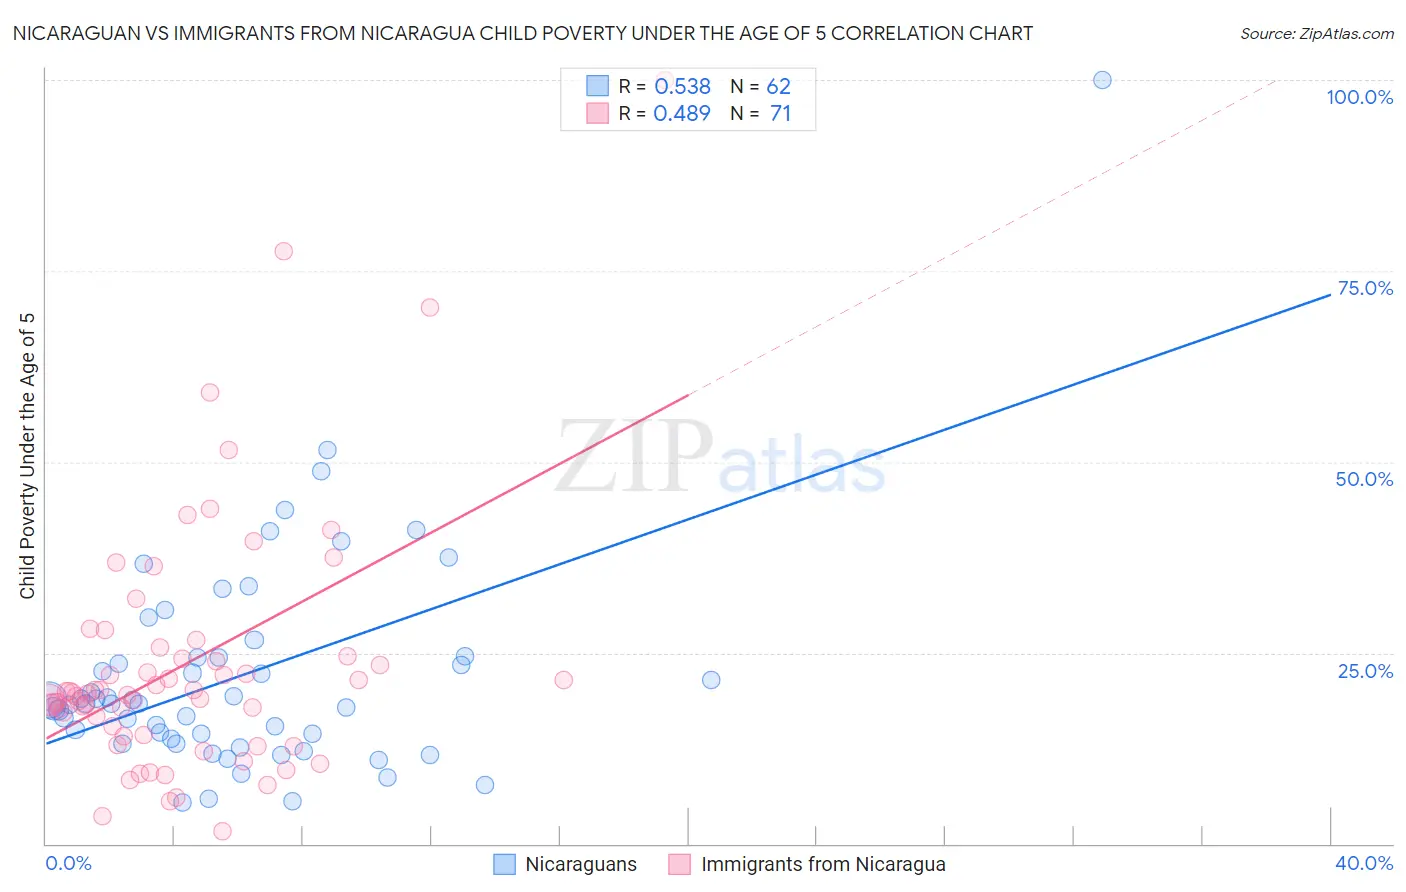
Nicaraguan vs Immigrants from Nicaragua Child Poverty Under the Age of 5 Correlation Chart
The statistical analysis conducted on geographies consisting of 279,523,506 people shows a substantial positive correlation between the proportion of Nicaraguans and poverty level among children under the age of 5 in the United States with a correlation coefficient (R) of 0.538 and weighted average of 19.1%. Similarly, the statistical analysis conducted on geographies consisting of 232,258,486 people shows a moderate positive correlation between the proportion of Immigrants from Nicaragua and poverty level among children under the age of 5 in the United States with a correlation coefficient (R) of 0.489 and weighted average of 19.8%, a difference of 3.7%.
Child Poverty Under the Age of 5 Correlation Summary
| Measurement | Nicaraguan | Immigrants from Nicaragua |
| Minimum | 5.4% | 1.7% |
| Maximum | 100.0% | 100.0% |
| Range | 94.6% | 98.3% |
| Mean | 22.0% | 23.5% |
| Median | 18.4% | 19.7% |
| Interquartile 25% (IQ1) | 13.8% | 14.3% |
| Interquartile 75% (IQ3) | 24.4% | 24.5% |
| Interquartile Range (IQR) | 10.7% | 10.2% |
| Standard Deviation (Sample) | 14.6% | 16.7% |
| Standard Deviation (Population) | 14.5% | 16.5% |
Similar Demographics by Child Poverty Under the Age of 5
Demographics Similar to Nicaraguans by Child Poverty Under the Age of 5
In terms of child poverty under the age of 5, the demographic groups most similar to Nicaraguans are Nigerian (19.1%, a difference of 0.030%), Immigrants from Eritrea (19.1%, a difference of 0.050%), Cuban (19.1%, a difference of 0.11%), Alsatian (19.1%, a difference of 0.13%), and Cape Verdean (19.1%, a difference of 0.23%).
| Demographics | Rating | Rank | Child Poverty Under the Age of 5 |
| Immigrants | Africa | 4.6 /100 | #217 | Tragic 18.6% |
| Delaware | 3.4 /100 | #218 | Tragic 18.7% |
| German Russians | 3.0 /100 | #219 | Tragic 18.8% |
| Immigrants | Azores | 2.6 /100 | #220 | Tragic 18.9% |
| Immigrants | Nigeria | 2.1 /100 | #221 | Tragic 19.0% |
| Alsatians | 1.7 /100 | #222 | Tragic 19.1% |
| Cubans | 1.7 /100 | #223 | Tragic 19.1% |
| Nicaraguans | 1.6 /100 | #224 | Tragic 19.1% |
| Nigerians | 1.6 /100 | #225 | Tragic 19.1% |
| Immigrants | Eritrea | 1.5 /100 | #226 | Tragic 19.1% |
| Cape Verdeans | 1.4 /100 | #227 | Tragic 19.1% |
| Immigrants | Sudan | 1.3 /100 | #228 | Tragic 19.2% |
| Ghanaians | 1.2 /100 | #229 | Tragic 19.2% |
| Ecuadorians | 1.2 /100 | #230 | Tragic 19.2% |
| Bermudans | 1.2 /100 | #231 | Tragic 19.2% |
Demographics Similar to Immigrants from Nicaragua by Child Poverty Under the Age of 5
In terms of child poverty under the age of 5, the demographic groups most similar to Immigrants from Nicaragua are Pennsylvania German (19.8%, a difference of 0.040%), Nonimmigrants (19.7%, a difference of 0.22%), Immigrants from Middle Africa (19.7%, a difference of 0.27%), Marshallese (19.7%, a difference of 0.29%), and Guyanese (19.7%, a difference of 0.30%).
| Demographics | Rating | Rank | Child Poverty Under the Age of 5 |
| Immigrants | Western Africa | 0.4 /100 | #245 | Tragic 19.7% |
| Cree | 0.4 /100 | #246 | Tragic 19.7% |
| Guyanese | 0.4 /100 | #247 | Tragic 19.7% |
| Marshallese | 0.4 /100 | #248 | Tragic 19.7% |
| Immigrants | Middle Africa | 0.4 /100 | #249 | Tragic 19.7% |
| Immigrants | Nonimmigrants | 0.4 /100 | #250 | Tragic 19.7% |
| Pennsylvania Germans | 0.3 /100 | #251 | Tragic 19.8% |
| Immigrants | Nicaragua | 0.3 /100 | #252 | Tragic 19.8% |
| Mexican American Indians | 0.3 /100 | #253 | Tragic 19.9% |
| Fijians | 0.3 /100 | #254 | Tragic 19.9% |
| Immigrants | Cuba | 0.2 /100 | #255 | Tragic 19.9% |
| Immigrants | Barbados | 0.2 /100 | #256 | Tragic 20.0% |
| Shoshone | 0.2 /100 | #257 | Tragic 20.0% |
| Immigrants | St. Vincent and the Grenadines | 0.2 /100 | #258 | Tragic 20.0% |
| Immigrants | El Salvador | 0.2 /100 | #259 | Tragic 20.0% |