Immigrants from Western Europe vs Blackfeet Child Poverty Under the Age of 5
COMPARE
Immigrants from Western Europe
Blackfeet
Child Poverty Under the Age of 5
Child Poverty Under the Age of 5 Comparison
Immigrants from Western Europe
Blackfeet
16.5%
CHILD POVERTY UNDER THE AGE OF 5
83.3/ 100
METRIC RATING
141st/ 347
METRIC RANK
21.8%
CHILD POVERTY UNDER THE AGE OF 5
0.0/ 100
METRIC RATING
298th/ 347
METRIC RANK
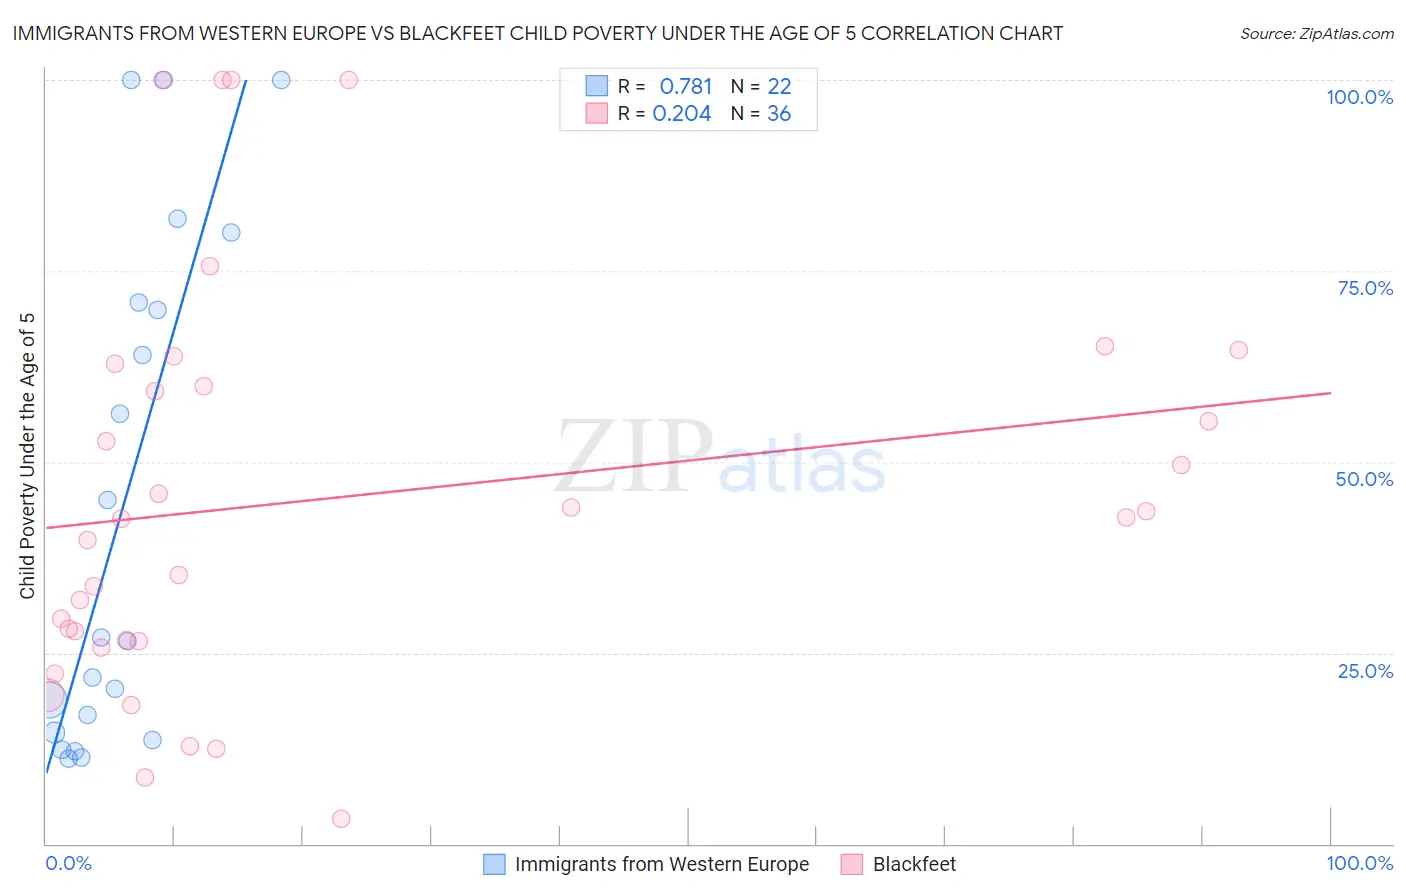
Immigrants from Western Europe vs Blackfeet Child Poverty Under the Age of 5 Correlation Chart
The statistical analysis conducted on geographies consisting of 467,153,267 people shows a strong positive correlation between the proportion of Immigrants from Western Europe and poverty level among children under the age of 5 in the United States with a correlation coefficient (R) of 0.781 and weighted average of 16.5%. Similarly, the statistical analysis conducted on geographies consisting of 302,829,294 people shows a weak positive correlation between the proportion of Blackfeet and poverty level among children under the age of 5 in the United States with a correlation coefficient (R) of 0.204 and weighted average of 21.8%, a difference of 32.1%.
Child Poverty Under the Age of 5 Correlation Summary
| Measurement | Immigrants from Western Europe | Blackfeet |
| Minimum | 11.1% | 3.3% |
| Maximum | 100.0% | 100.0% |
| Range | 88.9% | 96.7% |
| Mean | 44.3% | 45.3% |
| Median | 26.7% | 42.7% |
| Interquartile 25% (IQ1) | 14.6% | 26.7% |
| Interquartile 75% (IQ3) | 70.8% | 61.4% |
| Interquartile Range (IQR) | 56.3% | 34.8% |
| Standard Deviation (Sample) | 33.1% | 26.4% |
| Standard Deviation (Population) | 32.4% | 26.1% |
Similar Demographics by Child Poverty Under the Age of 5
Demographics Similar to Immigrants from Western Europe by Child Poverty Under the Age of 5
In terms of child poverty under the age of 5, the demographic groups most similar to Immigrants from Western Europe are Portuguese (16.5%, a difference of 0.040%), Samoan (16.5%, a difference of 0.050%), Ethiopian (16.5%, a difference of 0.11%), Guamanian/Chamorro (16.5%, a difference of 0.19%), and Immigrants from Ethiopia (16.6%, a difference of 0.22%).
| Demographics | Rating | Rank | Child Poverty Under the Age of 5 |
| Immigrants | North Macedonia | 87.8 /100 | #134 | Excellent 16.4% |
| Brazilians | 87.8 /100 | #135 | Excellent 16.4% |
| Immigrants | Northern Africa | 87.5 /100 | #136 | Excellent 16.4% |
| Immigrants | Chile | 85.3 /100 | #137 | Excellent 16.4% |
| Germans | 84.8 /100 | #138 | Excellent 16.5% |
| Immigrants | Hungary | 84.5 /100 | #139 | Excellent 16.5% |
| Guamanians/Chamorros | 84.2 /100 | #140 | Excellent 16.5% |
| Immigrants | Western Europe | 83.3 /100 | #141 | Excellent 16.5% |
| Portuguese | 83.0 /100 | #142 | Excellent 16.5% |
| Samoans | 83.0 /100 | #143 | Excellent 16.5% |
| Ethiopians | 82.7 /100 | #144 | Excellent 16.5% |
| Immigrants | Ethiopia | 82.1 /100 | #145 | Excellent 16.6% |
| Israelis | 82.0 /100 | #146 | Excellent 16.6% |
| Immigrants | Nepal | 80.3 /100 | #147 | Excellent 16.6% |
| Syrians | 79.1 /100 | #148 | Good 16.6% |
Demographics Similar to Blackfeet by Child Poverty Under the Age of 5
In terms of child poverty under the age of 5, the demographic groups most similar to Blackfeet are Chickasaw (21.8%, a difference of 0.0%), Alaskan Athabascan (21.8%, a difference of 0.010%), Hispanic or Latino (21.7%, a difference of 0.39%), Yaqui (21.7%, a difference of 0.40%), and Cherokee (21.7%, a difference of 0.56%).
| Demographics | Rating | Rank | Child Poverty Under the Age of 5 |
| British West Indians | 0.0 /100 | #291 | Tragic 21.4% |
| Immigrants | Somalia | 0.0 /100 | #292 | Tragic 21.6% |
| Mexicans | 0.0 /100 | #293 | Tragic 21.6% |
| Guatemalans | 0.0 /100 | #294 | Tragic 21.6% |
| Cherokee | 0.0 /100 | #295 | Tragic 21.7% |
| Yaqui | 0.0 /100 | #296 | Tragic 21.7% |
| Hispanics or Latinos | 0.0 /100 | #297 | Tragic 21.7% |
| Blackfeet | 0.0 /100 | #298 | Tragic 21.8% |
| Chickasaw | 0.0 /100 | #299 | Tragic 21.8% |
| Alaskan Athabascans | 0.0 /100 | #300 | Tragic 21.8% |
| Immigrants | Central America | 0.0 /100 | #301 | Tragic 22.0% |
| Iroquois | 0.0 /100 | #302 | Tragic 22.0% |
| Inupiat | 0.0 /100 | #303 | Tragic 22.0% |
| Immigrants | Guatemala | 0.0 /100 | #304 | Tragic 22.0% |
| Immigrants | Mexico | 0.0 /100 | #305 | Tragic 22.2% |