Immigrants from Poland vs Immigrants from Nicaragua Child Poverty Under the Age of 5
COMPARE
Immigrants from Poland
Immigrants from Nicaragua
Child Poverty Under the Age of 5
Child Poverty Under the Age of 5 Comparison
Immigrants from Poland
Immigrants from Nicaragua
15.1%
CHILD POVERTY UNDER THE AGE OF 5
99.1/ 100
METRIC RATING
61st/ 347
METRIC RANK
19.8%
CHILD POVERTY UNDER THE AGE OF 5
0.3/ 100
METRIC RATING
252nd/ 347
METRIC RANK
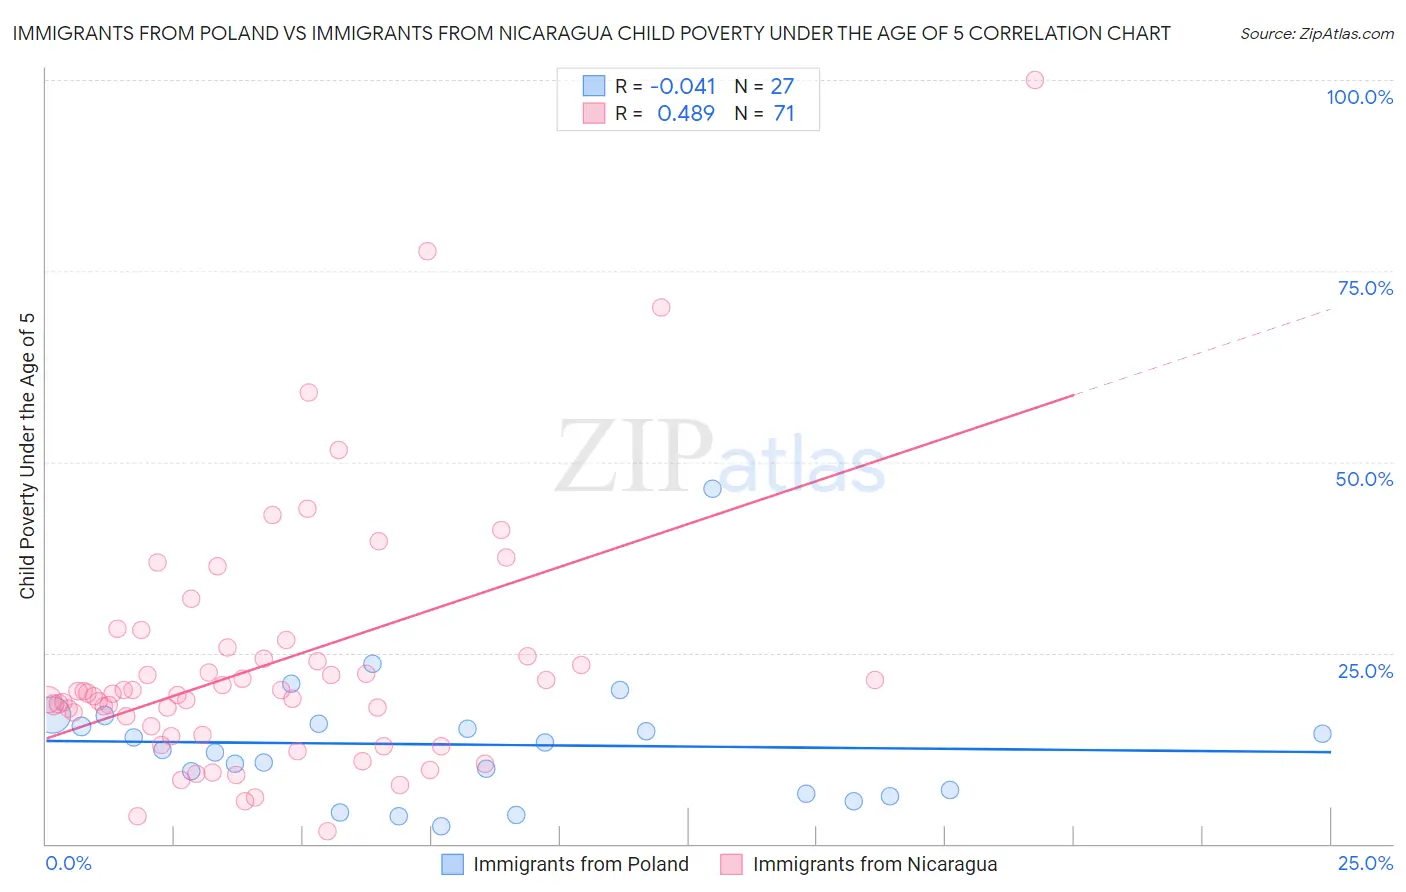
Immigrants from Poland vs Immigrants from Nicaragua Child Poverty Under the Age of 5 Correlation Chart
The statistical analysis conducted on geographies consisting of 290,713,862 people shows no correlation between the proportion of Immigrants from Poland and poverty level among children under the age of 5 in the United States with a correlation coefficient (R) of -0.041 and weighted average of 15.1%. Similarly, the statistical analysis conducted on geographies consisting of 232,258,486 people shows a moderate positive correlation between the proportion of Immigrants from Nicaragua and poverty level among children under the age of 5 in the United States with a correlation coefficient (R) of 0.489 and weighted average of 19.8%, a difference of 30.9%.
Child Poverty Under the Age of 5 Correlation Summary
| Measurement | Immigrants from Poland | Immigrants from Nicaragua |
| Minimum | 2.2% | 1.7% |
| Maximum | 46.5% | 100.0% |
| Range | 44.3% | 98.3% |
| Mean | 13.0% | 23.5% |
| Median | 12.3% | 19.7% |
| Interquartile 25% (IQ1) | 6.5% | 14.3% |
| Interquartile 75% (IQ3) | 15.7% | 24.5% |
| Interquartile Range (IQR) | 9.2% | 10.2% |
| Standard Deviation (Sample) | 8.7% | 16.7% |
| Standard Deviation (Population) | 8.6% | 16.5% |
Similar Demographics by Child Poverty Under the Age of 5
Demographics Similar to Immigrants from Poland by Child Poverty Under the Age of 5
In terms of child poverty under the age of 5, the demographic groups most similar to Immigrants from Poland are Immigrants from Eastern Europe (15.1%, a difference of 0.12%), Immigrants from Europe (15.1%, a difference of 0.25%), Immigrants from Romania (15.2%, a difference of 0.27%), Immigrants from Fiji (15.2%, a difference of 0.30%), and Immigrants from Scotland (15.2%, a difference of 0.42%).
| Demographics | Rating | Rank | Child Poverty Under the Age of 5 |
| Immigrants | Israel | 99.4 /100 | #54 | Exceptional 14.9% |
| Danes | 99.4 /100 | #55 | Exceptional 14.9% |
| Immigrants | Pakistan | 99.4 /100 | #56 | Exceptional 14.9% |
| Egyptians | 99.4 /100 | #57 | Exceptional 14.9% |
| Swedes | 99.4 /100 | #58 | Exceptional 15.0% |
| Paraguayans | 99.4 /100 | #59 | Exceptional 15.0% |
| Immigrants | Russia | 99.3 /100 | #60 | Exceptional 15.0% |
| Immigrants | Poland | 99.1 /100 | #61 | Exceptional 15.1% |
| Immigrants | Eastern Europe | 99.1 /100 | #62 | Exceptional 15.1% |
| Immigrants | Europe | 99.1 /100 | #63 | Exceptional 15.1% |
| Immigrants | Romania | 99.1 /100 | #64 | Exceptional 15.2% |
| Immigrants | Fiji | 99.0 /100 | #65 | Exceptional 15.2% |
| Immigrants | Scotland | 99.0 /100 | #66 | Exceptional 15.2% |
| Greeks | 99.0 /100 | #67 | Exceptional 15.2% |
| Zimbabweans | 99.0 /100 | #68 | Exceptional 15.2% |
Demographics Similar to Immigrants from Nicaragua by Child Poverty Under the Age of 5
In terms of child poverty under the age of 5, the demographic groups most similar to Immigrants from Nicaragua are Pennsylvania German (19.8%, a difference of 0.040%), Nonimmigrants (19.7%, a difference of 0.22%), Immigrants from Middle Africa (19.7%, a difference of 0.27%), Marshallese (19.7%, a difference of 0.29%), and Guyanese (19.7%, a difference of 0.30%).
| Demographics | Rating | Rank | Child Poverty Under the Age of 5 |
| Immigrants | Western Africa | 0.4 /100 | #245 | Tragic 19.7% |
| Cree | 0.4 /100 | #246 | Tragic 19.7% |
| Guyanese | 0.4 /100 | #247 | Tragic 19.7% |
| Marshallese | 0.4 /100 | #248 | Tragic 19.7% |
| Immigrants | Middle Africa | 0.4 /100 | #249 | Tragic 19.7% |
| Immigrants | Nonimmigrants | 0.4 /100 | #250 | Tragic 19.7% |
| Pennsylvania Germans | 0.3 /100 | #251 | Tragic 19.8% |
| Immigrants | Nicaragua | 0.3 /100 | #252 | Tragic 19.8% |
| Mexican American Indians | 0.3 /100 | #253 | Tragic 19.9% |
| Fijians | 0.3 /100 | #254 | Tragic 19.9% |
| Immigrants | Cuba | 0.2 /100 | #255 | Tragic 19.9% |
| Immigrants | Barbados | 0.2 /100 | #256 | Tragic 20.0% |
| Shoshone | 0.2 /100 | #257 | Tragic 20.0% |
| Immigrants | St. Vincent and the Grenadines | 0.2 /100 | #258 | Tragic 20.0% |
| Immigrants | El Salvador | 0.2 /100 | #259 | Tragic 20.0% |