Yaqui vs Immigrants from Nicaragua Child Poverty Under the Age of 5
COMPARE
Yaqui
Immigrants from Nicaragua
Child Poverty Under the Age of 5
Child Poverty Under the Age of 5 Comparison
Yaqui
Immigrants from Nicaragua
21.7%
CHILD POVERTY UNDER THE AGE OF 5
0.0/ 100
METRIC RATING
296th/ 347
METRIC RANK
19.8%
CHILD POVERTY UNDER THE AGE OF 5
0.3/ 100
METRIC RATING
252nd/ 347
METRIC RANK
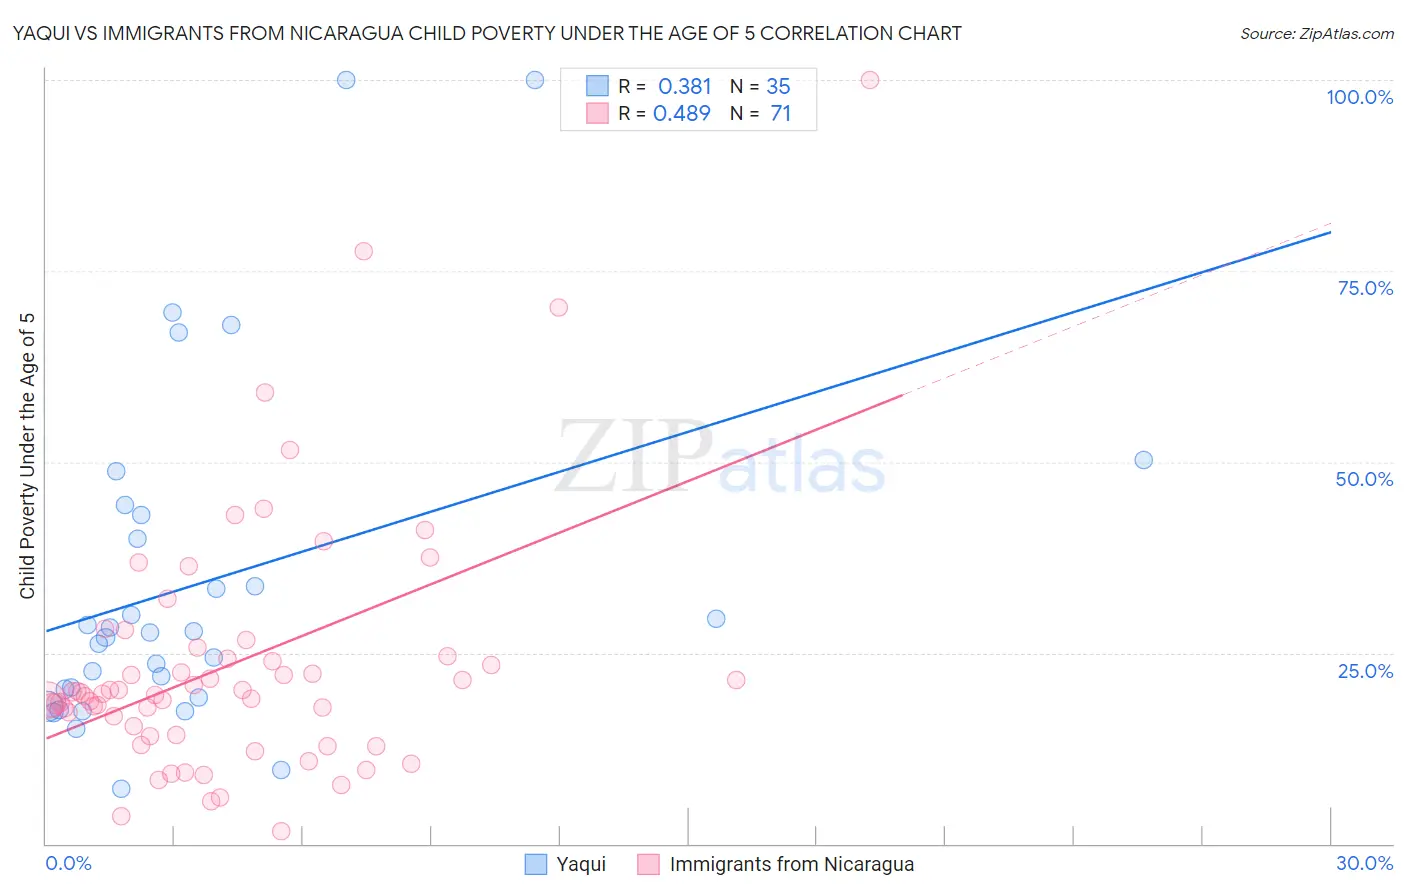
Yaqui vs Immigrants from Nicaragua Child Poverty Under the Age of 5 Correlation Chart
The statistical analysis conducted on geographies consisting of 106,801,066 people shows a mild positive correlation between the proportion of Yaqui and poverty level among children under the age of 5 in the United States with a correlation coefficient (R) of 0.381 and weighted average of 21.7%. Similarly, the statistical analysis conducted on geographies consisting of 232,258,486 people shows a moderate positive correlation between the proportion of Immigrants from Nicaragua and poverty level among children under the age of 5 in the United States with a correlation coefficient (R) of 0.489 and weighted average of 19.8%, a difference of 9.8%.
Child Poverty Under the Age of 5 Correlation Summary
| Measurement | Yaqui | Immigrants from Nicaragua |
| Minimum | 7.1% | 1.7% |
| Maximum | 100.0% | 100.0% |
| Range | 92.9% | 98.3% |
| Mean | 34.1% | 23.5% |
| Median | 27.7% | 19.7% |
| Interquartile 25% (IQ1) | 19.2% | 14.3% |
| Interquartile 75% (IQ3) | 43.1% | 24.5% |
| Interquartile Range (IQR) | 23.9% | 10.2% |
| Standard Deviation (Sample) | 22.6% | 16.7% |
| Standard Deviation (Population) | 22.2% | 16.5% |
Similar Demographics by Child Poverty Under the Age of 5
Demographics Similar to Yaqui by Child Poverty Under the Age of 5
In terms of child poverty under the age of 5, the demographic groups most similar to Yaqui are Hispanic or Latino (21.7%, a difference of 0.020%), Cherokee (21.7%, a difference of 0.15%), Blackfeet (21.8%, a difference of 0.40%), Guatemalan (21.6%, a difference of 0.41%), and Chickasaw (21.8%, a difference of 0.41%).
| Demographics | Rating | Rank | Child Poverty Under the Age of 5 |
| Immigrants | Haiti | 0.0 /100 | #289 | Tragic 21.3% |
| Immigrants | Caribbean | 0.0 /100 | #290 | Tragic 21.4% |
| British West Indians | 0.0 /100 | #291 | Tragic 21.4% |
| Immigrants | Somalia | 0.0 /100 | #292 | Tragic 21.6% |
| Mexicans | 0.0 /100 | #293 | Tragic 21.6% |
| Guatemalans | 0.0 /100 | #294 | Tragic 21.6% |
| Cherokee | 0.0 /100 | #295 | Tragic 21.7% |
| Yaqui | 0.0 /100 | #296 | Tragic 21.7% |
| Hispanics or Latinos | 0.0 /100 | #297 | Tragic 21.7% |
| Blackfeet | 0.0 /100 | #298 | Tragic 21.8% |
| Chickasaw | 0.0 /100 | #299 | Tragic 21.8% |
| Alaskan Athabascans | 0.0 /100 | #300 | Tragic 21.8% |
| Immigrants | Central America | 0.0 /100 | #301 | Tragic 22.0% |
| Iroquois | 0.0 /100 | #302 | Tragic 22.0% |
| Inupiat | 0.0 /100 | #303 | Tragic 22.0% |
Demographics Similar to Immigrants from Nicaragua by Child Poverty Under the Age of 5
In terms of child poverty under the age of 5, the demographic groups most similar to Immigrants from Nicaragua are Pennsylvania German (19.8%, a difference of 0.040%), Nonimmigrants (19.7%, a difference of 0.22%), Immigrants from Middle Africa (19.7%, a difference of 0.27%), Marshallese (19.7%, a difference of 0.29%), and Guyanese (19.7%, a difference of 0.30%).
| Demographics | Rating | Rank | Child Poverty Under the Age of 5 |
| Immigrants | Western Africa | 0.4 /100 | #245 | Tragic 19.7% |
| Cree | 0.4 /100 | #246 | Tragic 19.7% |
| Guyanese | 0.4 /100 | #247 | Tragic 19.7% |
| Marshallese | 0.4 /100 | #248 | Tragic 19.7% |
| Immigrants | Middle Africa | 0.4 /100 | #249 | Tragic 19.7% |
| Immigrants | Nonimmigrants | 0.4 /100 | #250 | Tragic 19.7% |
| Pennsylvania Germans | 0.3 /100 | #251 | Tragic 19.8% |
| Immigrants | Nicaragua | 0.3 /100 | #252 | Tragic 19.8% |
| Mexican American Indians | 0.3 /100 | #253 | Tragic 19.9% |
| Fijians | 0.3 /100 | #254 | Tragic 19.9% |
| Immigrants | Cuba | 0.2 /100 | #255 | Tragic 19.9% |
| Immigrants | Barbados | 0.2 /100 | #256 | Tragic 20.0% |
| Shoshone | 0.2 /100 | #257 | Tragic 20.0% |
| Immigrants | St. Vincent and the Grenadines | 0.2 /100 | #258 | Tragic 20.0% |
| Immigrants | El Salvador | 0.2 /100 | #259 | Tragic 20.0% |