Immigrants from Vietnam vs Immigrants from Denmark Single Father Poverty
COMPARE
Immigrants from Vietnam
Immigrants from Denmark
Single Father Poverty
Single Father Poverty Comparison
Immigrants from Vietnam
Immigrants from Denmark
14.1%
SINGLE FATHER POVERTY
100.0/ 100
METRIC RATING
14th/ 347
METRIC RANK
16.7%
SINGLE FATHER POVERTY
8.1/ 100
METRIC RATING
220th/ 347
METRIC RANK
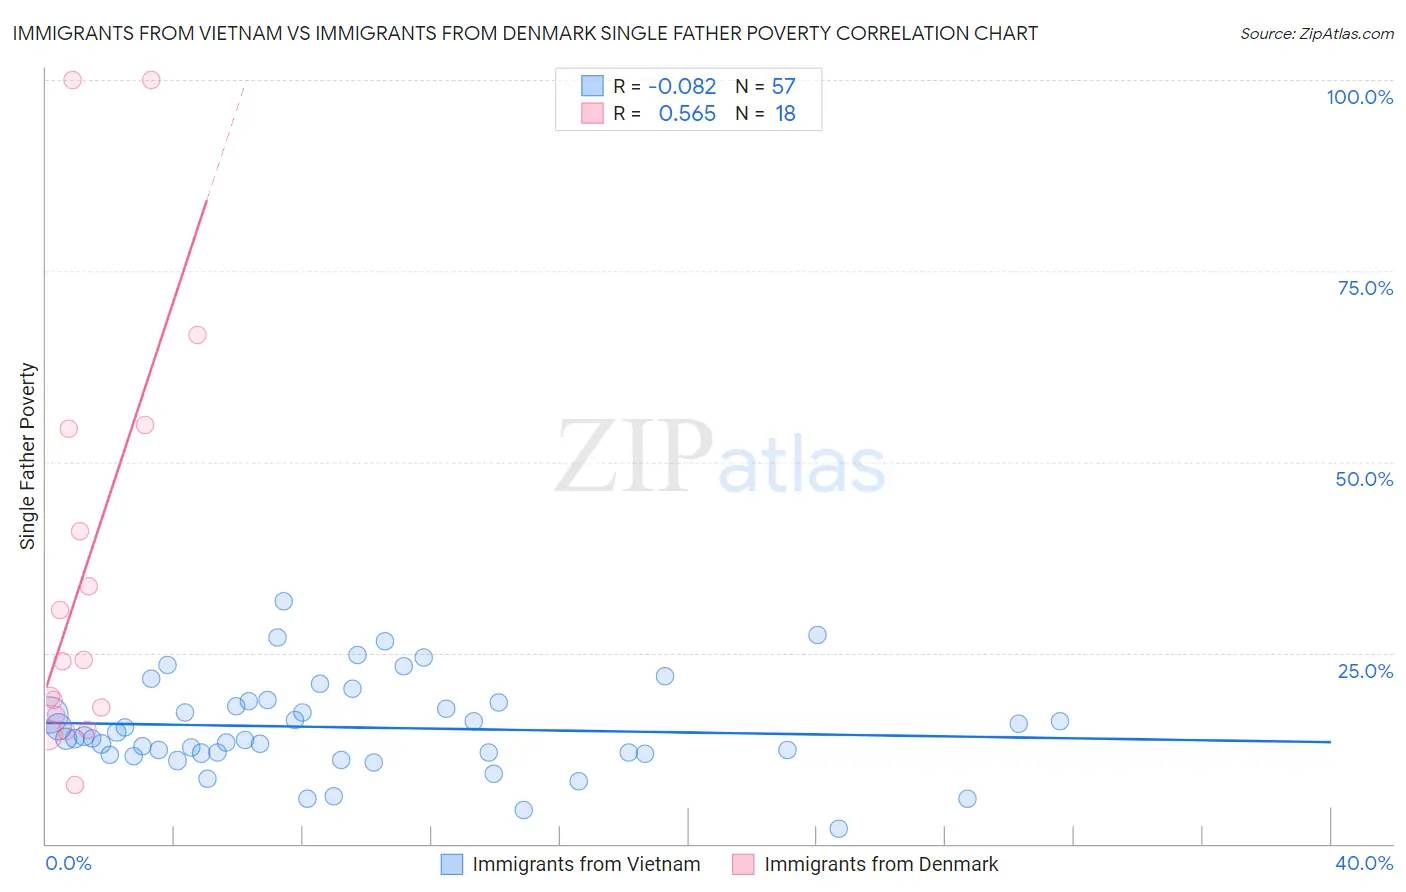
Immigrants from Vietnam vs Immigrants from Denmark Single Father Poverty Correlation Chart
The statistical analysis conducted on geographies consisting of 320,936,660 people shows a slight negative correlation between the proportion of Immigrants from Vietnam and poverty level among single fathers in the United States with a correlation coefficient (R) of -0.082 and weighted average of 14.1%. Similarly, the statistical analysis conducted on geographies consisting of 116,977,797 people shows a substantial positive correlation between the proportion of Immigrants from Denmark and poverty level among single fathers in the United States with a correlation coefficient (R) of 0.565 and weighted average of 16.7%, a difference of 18.3%.
Single Father Poverty Correlation Summary
| Measurement | Immigrants from Vietnam | Immigrants from Denmark |
| Minimum | 2.0% | 7.7% |
| Maximum | 31.8% | 100.0% |
| Range | 29.8% | 92.3% |
| Mean | 15.2% | 36.3% |
| Median | 13.8% | 24.0% |
| Interquartile 25% (IQ1) | 11.8% | 16.9% |
| Interquartile 75% (IQ3) | 18.5% | 54.3% |
| Interquartile Range (IQR) | 6.7% | 37.4% |
| Standard Deviation (Sample) | 6.1% | 28.3% |
| Standard Deviation (Population) | 6.0% | 27.5% |
Similar Demographics by Single Father Poverty
Demographics Similar to Immigrants from Vietnam by Single Father Poverty
In terms of single father poverty, the demographic groups most similar to Immigrants from Vietnam are Sri Lankan (14.2%, a difference of 0.050%), Immigrants from Iran (14.2%, a difference of 0.26%), Immigrants from Philippines (14.0%, a difference of 0.70%), Immigrants from Hong Kong (14.2%, a difference of 0.71%), and Soviet Union (14.3%, a difference of 0.74%).
| Demographics | Rating | Rank | Single Father Poverty |
| Immigrants | Taiwan | 100.0 /100 | #7 | Exceptional 13.7% |
| Samoans | 100.0 /100 | #8 | Exceptional 13.8% |
| Afghans | 100.0 /100 | #9 | Exceptional 14.0% |
| Koreans | 100.0 /100 | #10 | Exceptional 14.0% |
| Filipinos | 100.0 /100 | #11 | Exceptional 14.0% |
| Immigrants | India | 100.0 /100 | #12 | Exceptional 14.0% |
| Immigrants | Philippines | 100.0 /100 | #13 | Exceptional 14.0% |
| Immigrants | Vietnam | 100.0 /100 | #14 | Exceptional 14.1% |
| Sri Lankans | 100.0 /100 | #15 | Exceptional 14.2% |
| Immigrants | Iran | 100.0 /100 | #16 | Exceptional 14.2% |
| Immigrants | Hong Kong | 100.0 /100 | #17 | Exceptional 14.2% |
| Soviet Union | 100.0 /100 | #18 | Exceptional 14.3% |
| Immigrants | Iraq | 100.0 /100 | #19 | Exceptional 14.3% |
| Immigrants | Singapore | 100.0 /100 | #20 | Exceptional 14.3% |
| Immigrants | Afghanistan | 100.0 /100 | #21 | Exceptional 14.3% |
Demographics Similar to Immigrants from Denmark by Single Father Poverty
In terms of single father poverty, the demographic groups most similar to Immigrants from Denmark are Immigrants from Greece (16.7%, a difference of 0.0%), Immigrants from Ghana (16.7%, a difference of 0.010%), Immigrants from Spain (16.7%, a difference of 0.010%), Immigrants from Uganda (16.7%, a difference of 0.070%), and Cheyenne (16.7%, a difference of 0.17%).
| Demographics | Rating | Rank | Single Father Poverty |
| Ghanaians | 11.0 /100 | #213 | Poor 16.7% |
| Spanish | 10.7 /100 | #214 | Poor 16.7% |
| Immigrants | Scotland | 9.6 /100 | #215 | Tragic 16.7% |
| Immigrants | England | 9.5 /100 | #216 | Tragic 16.7% |
| Cheyenne | 9.3 /100 | #217 | Tragic 16.7% |
| Immigrants | Uganda | 8.6 /100 | #218 | Tragic 16.7% |
| Immigrants | Ghana | 8.1 /100 | #219 | Tragic 16.7% |
| Immigrants | Denmark | 8.1 /100 | #220 | Tragic 16.7% |
| Immigrants | Greece | 8.1 /100 | #221 | Tragic 16.7% |
| Immigrants | Spain | 8.0 /100 | #222 | Tragic 16.7% |
| Immigrants | Austria | 7.0 /100 | #223 | Tragic 16.8% |
| Immigrants | Norway | 6.5 /100 | #224 | Tragic 16.8% |
| Menominee | 6.4 /100 | #225 | Tragic 16.8% |
| Hispanics or Latinos | 6.1 /100 | #226 | Tragic 16.8% |
| British | 5.6 /100 | #227 | Tragic 16.8% |