Immigrants from Uzbekistan vs Spanish American Female Poverty
COMPARE
Immigrants from Uzbekistan
Spanish American
Female Poverty
Female Poverty Comparison
Immigrants from Uzbekistan
Spanish Americans
14.4%
FEMALE POVERTY
4.4/ 100
METRIC RATING
218th/ 347
METRIC RANK
16.2%
FEMALE POVERTY
0.0/ 100
METRIC RATING
284th/ 347
METRIC RANK
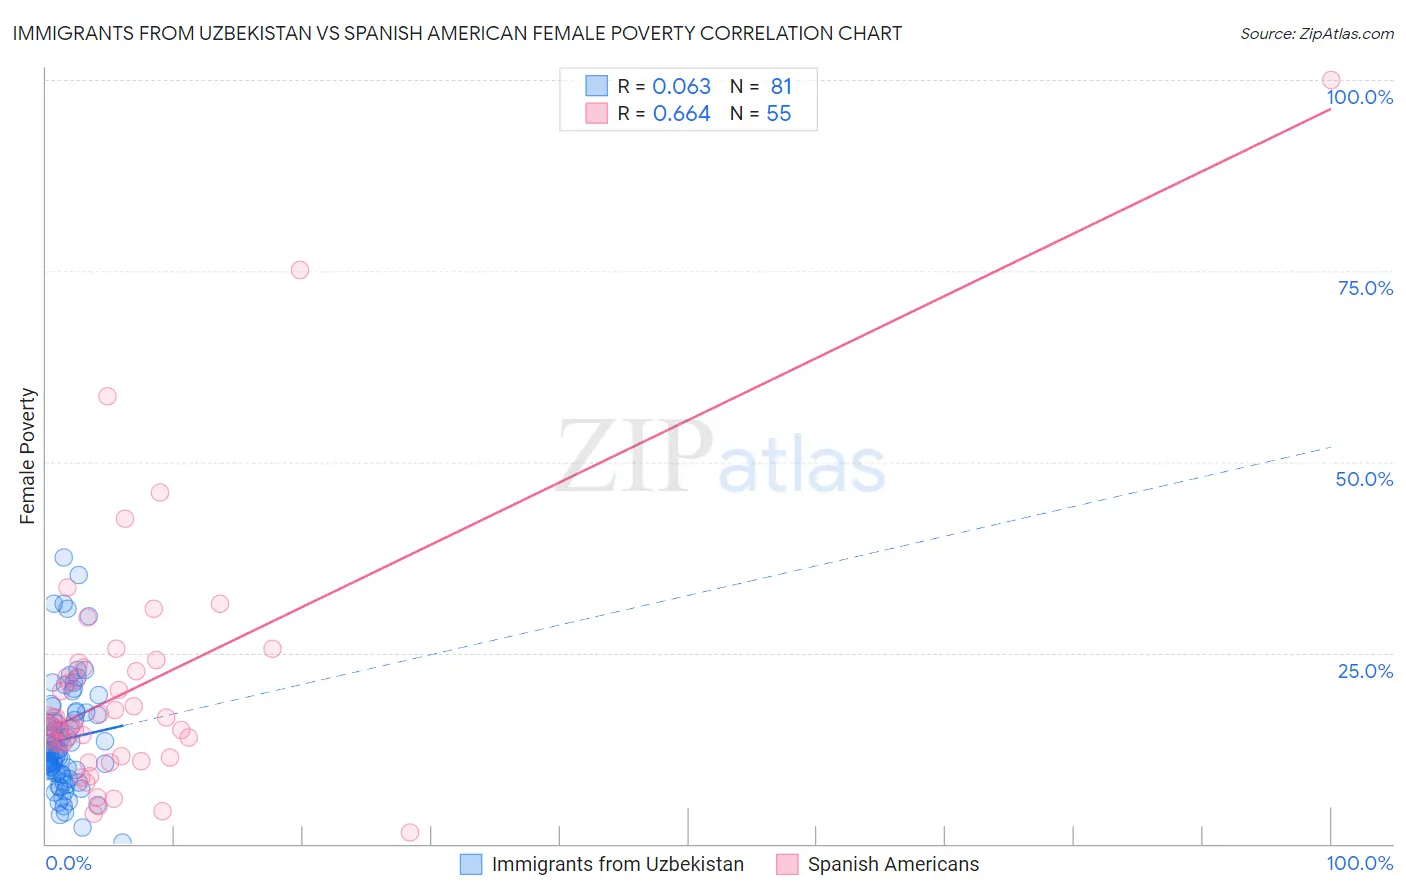
Immigrants from Uzbekistan vs Spanish American Female Poverty Correlation Chart
The statistical analysis conducted on geographies consisting of 118,710,626 people shows a slight positive correlation between the proportion of Immigrants from Uzbekistan and poverty level among females in the United States with a correlation coefficient (R) of 0.063 and weighted average of 14.4%. Similarly, the statistical analysis conducted on geographies consisting of 103,161,919 people shows a significant positive correlation between the proportion of Spanish Americans and poverty level among females in the United States with a correlation coefficient (R) of 0.664 and weighted average of 16.2%, a difference of 11.9%.
Female Poverty Correlation Summary
| Measurement | Immigrants from Uzbekistan | Spanish American |
| Minimum | 0.21% | 1.4% |
| Maximum | 37.5% | 100.0% |
| Range | 37.3% | 98.6% |
| Mean | 13.7% | 20.4% |
| Median | 12.3% | 15.6% |
| Interquartile 25% (IQ1) | 9.1% | 11.5% |
| Interquartile 75% (IQ3) | 17.2% | 23.0% |
| Interquartile Range (IQR) | 8.0% | 11.5% |
| Standard Deviation (Sample) | 7.4% | 17.0% |
| Standard Deviation (Population) | 7.3% | 16.8% |
Similar Demographics by Female Poverty
Demographics Similar to Immigrants from Uzbekistan by Female Poverty
In terms of female poverty, the demographic groups most similar to Immigrants from Uzbekistan are Immigrants (14.4%, a difference of 0.050%), Immigrants from Thailand (14.4%, a difference of 0.080%), Japanese (14.5%, a difference of 0.14%), Immigrants from Panama (14.4%, a difference of 0.17%), and Alsatian (14.5%, a difference of 0.18%).
| Demographics | Rating | Rank | Female Poverty |
| Moroccans | 7.2 /100 | #211 | Tragic 14.3% |
| Bermudans | 5.5 /100 | #212 | Tragic 14.4% |
| Alaskan Athabascans | 5.3 /100 | #213 | Tragic 14.4% |
| Marshallese | 5.0 /100 | #214 | Tragic 14.4% |
| Immigrants | Panama | 4.7 /100 | #215 | Tragic 14.4% |
| Immigrants | Thailand | 4.5 /100 | #216 | Tragic 14.4% |
| Immigrants | Immigrants | 4.5 /100 | #217 | Tragic 14.4% |
| Immigrants | Uzbekistan | 4.4 /100 | #218 | Tragic 14.4% |
| Japanese | 4.1 /100 | #219 | Tragic 14.5% |
| Alsatians | 4.0 /100 | #220 | Tragic 14.5% |
| Immigrants | Cambodia | 3.7 /100 | #221 | Tragic 14.5% |
| Immigrants | Nonimmigrants | 3.7 /100 | #222 | Tragic 14.5% |
| Immigrants | Africa | 3.3 /100 | #223 | Tragic 14.5% |
| Americans | 2.8 /100 | #224 | Tragic 14.6% |
| Immigrants | Micronesia | 2.8 /100 | #225 | Tragic 14.6% |
Demographics Similar to Spanish Americans by Female Poverty
In terms of female poverty, the demographic groups most similar to Spanish Americans are Immigrants from Cuba (16.1%, a difference of 0.050%), Comanche (16.2%, a difference of 0.080%), Immigrants from Haiti (16.1%, a difference of 0.13%), West Indian (16.1%, a difference of 0.29%), and Vietnamese (16.1%, a difference of 0.31%).
| Demographics | Rating | Rank | Female Poverty |
| Bangladeshis | 0.0 /100 | #277 | Tragic 16.0% |
| Immigrants | West Indies | 0.0 /100 | #278 | Tragic 16.1% |
| Immigrants | Bahamas | 0.0 /100 | #279 | Tragic 16.1% |
| Vietnamese | 0.0 /100 | #280 | Tragic 16.1% |
| West Indians | 0.0 /100 | #281 | Tragic 16.1% |
| Immigrants | Haiti | 0.0 /100 | #282 | Tragic 16.1% |
| Immigrants | Cuba | 0.0 /100 | #283 | Tragic 16.1% |
| Spanish Americans | 0.0 /100 | #284 | Tragic 16.2% |
| Comanche | 0.0 /100 | #285 | Tragic 16.2% |
| Inupiat | 0.0 /100 | #286 | Tragic 16.2% |
| Immigrants | Belize | 0.0 /100 | #287 | Tragic 16.3% |
| Indonesians | 0.0 /100 | #288 | Tragic 16.4% |
| Blackfeet | 0.0 /100 | #289 | Tragic 16.4% |
| Immigrants | Bangladesh | 0.0 /100 | #290 | Tragic 16.4% |
| Yaqui | 0.0 /100 | #291 | Tragic 16.4% |