Immigrants from Uzbekistan vs Immigrants from India Poverty
COMPARE
Immigrants from Uzbekistan
Immigrants from India
Poverty
Poverty Comparison
Immigrants from Uzbekistan
Immigrants from India
13.3%
POVERTY
3.2/ 100
METRIC RATING
217th/ 347
METRIC RANK
9.0%
POVERTY
100.0/ 100
METRIC RATING
1st/ 347
METRIC RANK
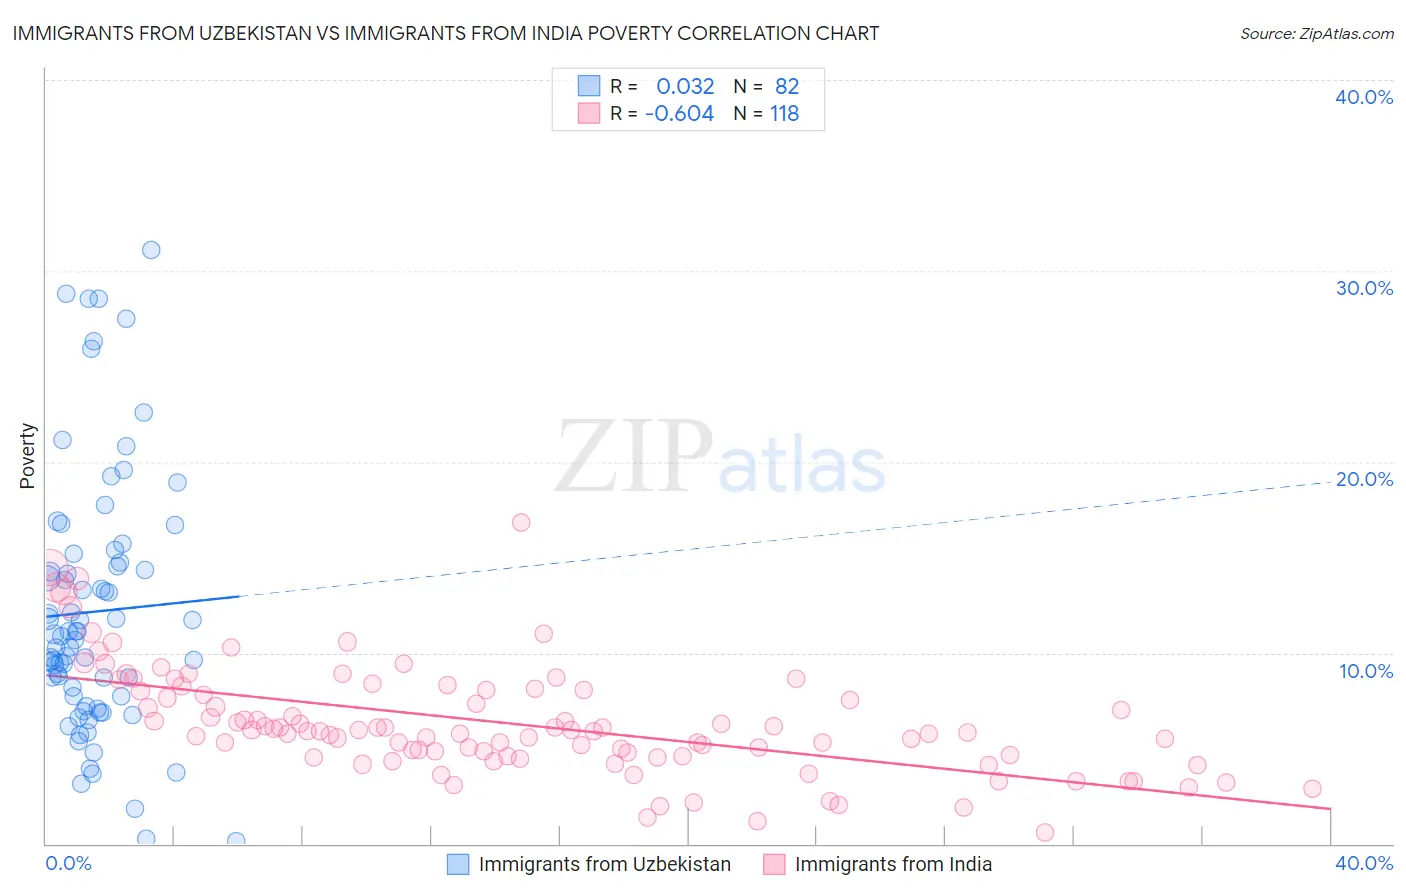
Immigrants from Uzbekistan vs Immigrants from India Poverty Correlation Chart
The statistical analysis conducted on geographies consisting of 118,719,831 people shows no correlation between the proportion of Immigrants from Uzbekistan and poverty level in the United States with a correlation coefficient (R) of 0.032 and weighted average of 13.3%. Similarly, the statistical analysis conducted on geographies consisting of 433,739,641 people shows a significant negative correlation between the proportion of Immigrants from India and poverty level in the United States with a correlation coefficient (R) of -0.604 and weighted average of 9.0%, a difference of 47.5%.
Poverty Correlation Summary
| Measurement | Immigrants from Uzbekistan | Immigrants from India |
| Minimum | 0.14% | 0.59% |
| Maximum | 31.1% | 16.8% |
| Range | 30.9% | 16.2% |
| Mean | 12.2% | 6.3% |
| Median | 10.9% | 5.9% |
| Interquartile 25% (IQ1) | 7.7% | 4.6% |
| Interquartile 75% (IQ3) | 14.7% | 8.0% |
| Interquartile Range (IQR) | 7.0% | 3.4% |
| Standard Deviation (Sample) | 6.7% | 2.8% |
| Standard Deviation (Population) | 6.7% | 2.8% |
Similar Demographics by Poverty
Demographics Similar to Immigrants from Uzbekistan by Poverty
In terms of poverty, the demographic groups most similar to Immigrants from Uzbekistan are Japanese (13.3%, a difference of 0.040%), Nonimmigrants (13.3%, a difference of 0.040%), Immigrants from Thailand (13.3%, a difference of 0.060%), Immigrants from Cambodia (13.4%, a difference of 0.19%), and American (13.4%, a difference of 0.28%).
| Demographics | Rating | Rank | Poverty |
| Immigrants | Azores | 6.1 /100 | #210 | Tragic 13.1% |
| Moroccans | 5.2 /100 | #211 | Tragic 13.2% |
| Immigrants | Immigrants | 4.3 /100 | #212 | Tragic 13.2% |
| Immigrants | Panama | 4.1 /100 | #213 | Tragic 13.3% |
| Bermudans | 3.7 /100 | #214 | Tragic 13.3% |
| Japanese | 3.3 /100 | #215 | Tragic 13.3% |
| Immigrants | Nonimmigrants | 3.3 /100 | #216 | Tragic 13.3% |
| Immigrants | Uzbekistan | 3.2 /100 | #217 | Tragic 13.3% |
| Immigrants | Thailand | 3.1 /100 | #218 | Tragic 13.3% |
| Immigrants | Cambodia | 3.0 /100 | #219 | Tragic 13.4% |
| Americans | 2.9 /100 | #220 | Tragic 13.4% |
| Alsatians | 2.6 /100 | #221 | Tragic 13.4% |
| Immigrants | Micronesia | 2.6 /100 | #222 | Tragic 13.4% |
| Immigrants | Africa | 2.5 /100 | #223 | Tragic 13.4% |
| Immigrants | Eritrea | 2.4 /100 | #224 | Tragic 13.4% |
Demographics Similar to Immigrants from India by Poverty
In terms of poverty, the demographic groups most similar to Immigrants from India are Chinese (9.5%, a difference of 5.6%), Thai (9.6%, a difference of 6.1%), Immigrants from Taiwan (9.7%, a difference of 7.6%), Immigrants from Ireland (10.1%, a difference of 11.6%), and Assyrian/Chaldean/Syriac (10.1%, a difference of 11.8%).
| Demographics | Rating | Rank | Poverty |
| Immigrants | India | 100.0 /100 | #1 | Exceptional 9.0% |
| Chinese | 100.0 /100 | #2 | Exceptional 9.5% |
| Thais | 100.0 /100 | #3 | Exceptional 9.6% |
| Immigrants | Taiwan | 100.0 /100 | #4 | Exceptional 9.7% |
| Immigrants | Ireland | 99.9 /100 | #5 | Exceptional 10.1% |
| Assyrians/Chaldeans/Syriacs | 99.9 /100 | #6 | Exceptional 10.1% |
| Filipinos | 99.9 /100 | #7 | Exceptional 10.1% |
| Maltese | 99.9 /100 | #8 | Exceptional 10.2% |
| Immigrants | South Central Asia | 99.9 /100 | #9 | Exceptional 10.2% |
| Bulgarians | 99.9 /100 | #10 | Exceptional 10.2% |
| Immigrants | Lithuania | 99.9 /100 | #11 | Exceptional 10.3% |
| Bhutanese | 99.8 /100 | #12 | Exceptional 10.4% |
| Immigrants | Hong Kong | 99.8 /100 | #13 | Exceptional 10.4% |
| Immigrants | Bolivia | 99.8 /100 | #14 | Exceptional 10.4% |
| Bolivians | 99.8 /100 | #15 | Exceptional 10.4% |