Immigrants from Uzbekistan vs Serbian Poverty
COMPARE
Immigrants from Uzbekistan
Serbian
Poverty
Poverty Comparison
Immigrants from Uzbekistan
Serbians
13.3%
POVERTY
3.2/ 100
METRIC RATING
217th/ 347
METRIC RANK
11.2%
POVERTY
97.4/ 100
METRIC RATING
69th/ 347
METRIC RANK
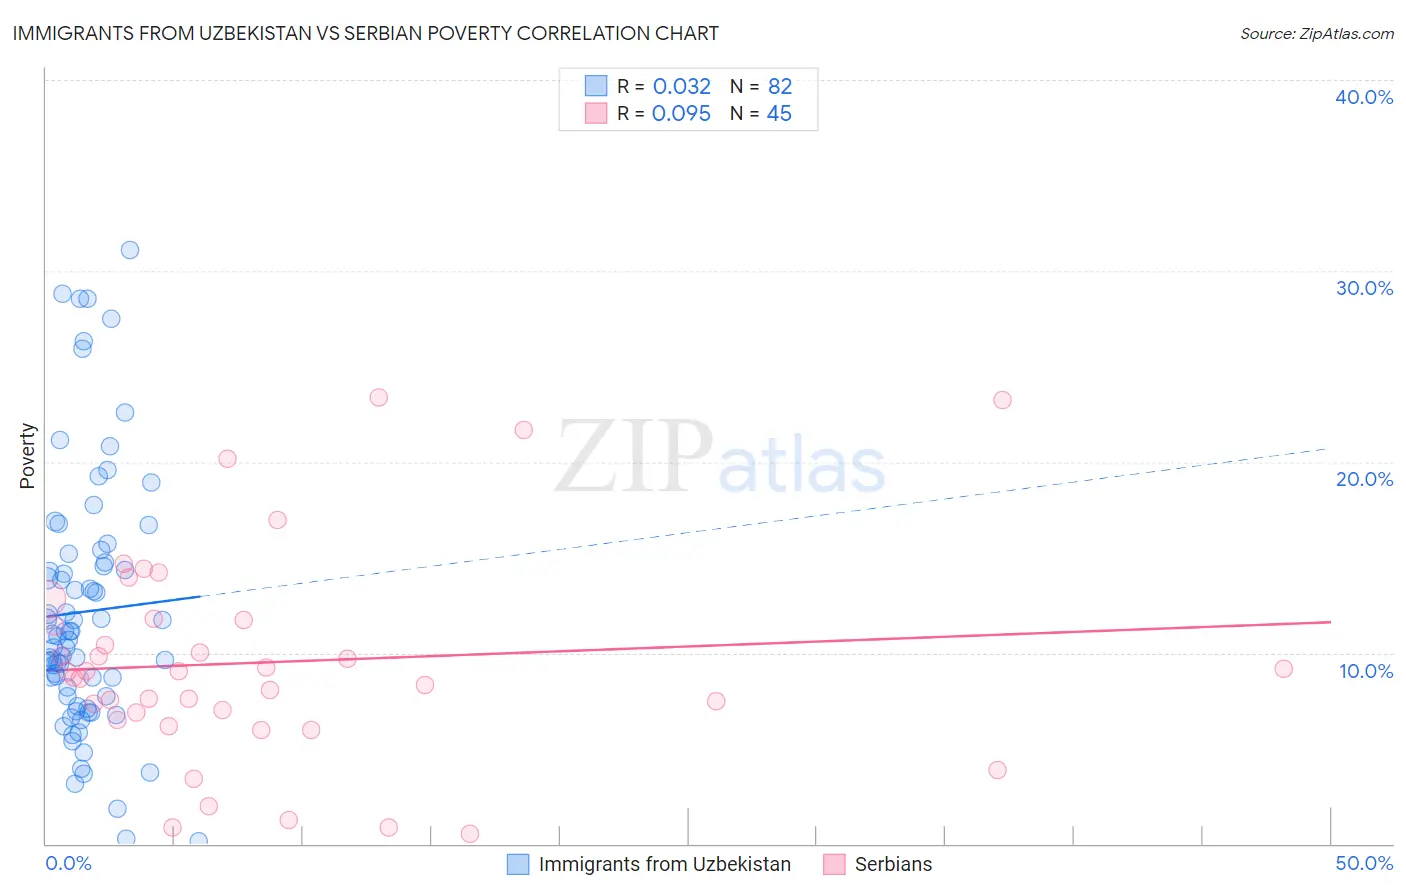
Immigrants from Uzbekistan vs Serbian Poverty Correlation Chart
The statistical analysis conducted on geographies consisting of 118,719,831 people shows no correlation between the proportion of Immigrants from Uzbekistan and poverty level in the United States with a correlation coefficient (R) of 0.032 and weighted average of 13.3%. Similarly, the statistical analysis conducted on geographies consisting of 267,537,143 people shows a slight positive correlation between the proportion of Serbians and poverty level in the United States with a correlation coefficient (R) of 0.095 and weighted average of 11.2%, a difference of 18.6%.
Poverty Correlation Summary
| Measurement | Immigrants from Uzbekistan | Serbian |
| Minimum | 0.14% | 0.55% |
| Maximum | 31.1% | 23.4% |
| Range | 30.9% | 22.8% |
| Mean | 12.2% | 9.5% |
| Median | 10.9% | 9.0% |
| Interquartile 25% (IQ1) | 7.7% | 6.7% |
| Interquartile 75% (IQ3) | 14.7% | 11.7% |
| Interquartile Range (IQR) | 7.0% | 5.0% |
| Standard Deviation (Sample) | 6.7% | 5.5% |
| Standard Deviation (Population) | 6.7% | 5.4% |
Similar Demographics by Poverty
Demographics Similar to Immigrants from Uzbekistan by Poverty
In terms of poverty, the demographic groups most similar to Immigrants from Uzbekistan are Japanese (13.3%, a difference of 0.040%), Nonimmigrants (13.3%, a difference of 0.040%), Immigrants from Thailand (13.3%, a difference of 0.060%), Immigrants from Cambodia (13.4%, a difference of 0.19%), and American (13.4%, a difference of 0.28%).
| Demographics | Rating | Rank | Poverty |
| Immigrants | Azores | 6.1 /100 | #210 | Tragic 13.1% |
| Moroccans | 5.2 /100 | #211 | Tragic 13.2% |
| Immigrants | Immigrants | 4.3 /100 | #212 | Tragic 13.2% |
| Immigrants | Panama | 4.1 /100 | #213 | Tragic 13.3% |
| Bermudans | 3.7 /100 | #214 | Tragic 13.3% |
| Japanese | 3.3 /100 | #215 | Tragic 13.3% |
| Immigrants | Nonimmigrants | 3.3 /100 | #216 | Tragic 13.3% |
| Immigrants | Uzbekistan | 3.2 /100 | #217 | Tragic 13.3% |
| Immigrants | Thailand | 3.1 /100 | #218 | Tragic 13.3% |
| Immigrants | Cambodia | 3.0 /100 | #219 | Tragic 13.4% |
| Americans | 2.9 /100 | #220 | Tragic 13.4% |
| Alsatians | 2.6 /100 | #221 | Tragic 13.4% |
| Immigrants | Micronesia | 2.6 /100 | #222 | Tragic 13.4% |
| Immigrants | Africa | 2.5 /100 | #223 | Tragic 13.4% |
| Immigrants | Eritrea | 2.4 /100 | #224 | Tragic 13.4% |
Demographics Similar to Serbians by Poverty
In terms of poverty, the demographic groups most similar to Serbians are Slovak (11.2%, a difference of 0.060%), Immigrants from Australia (11.2%, a difference of 0.080%), Immigrants from Canada (11.3%, a difference of 0.090%), Zimbabwean (11.3%, a difference of 0.11%), and Immigrants from Netherlands (11.2%, a difference of 0.12%).
| Demographics | Rating | Rank | Poverty |
| Austrians | 97.8 /100 | #62 | Exceptional 11.2% |
| Ukrainians | 97.8 /100 | #63 | Exceptional 11.2% |
| Swiss | 97.7 /100 | #64 | Exceptional 11.2% |
| Immigrants | Asia | 97.5 /100 | #65 | Exceptional 11.2% |
| Immigrants | Netherlands | 97.5 /100 | #66 | Exceptional 11.2% |
| Immigrants | Australia | 97.4 /100 | #67 | Exceptional 11.2% |
| Slovaks | 97.4 /100 | #68 | Exceptional 11.2% |
| Serbians | 97.4 /100 | #69 | Exceptional 11.2% |
| Immigrants | Canada | 97.3 /100 | #70 | Exceptional 11.3% |
| Zimbabweans | 97.3 /100 | #71 | Exceptional 11.3% |
| Europeans | 97.2 /100 | #72 | Exceptional 11.3% |
| Immigrants | Belgium | 97.2 /100 | #73 | Exceptional 11.3% |
| Carpatho Rusyns | 97.2 /100 | #74 | Exceptional 11.3% |
| Immigrants | Eastern Europe | 97.0 /100 | #75 | Exceptional 11.3% |
| Immigrants | North America | 96.8 /100 | #76 | Exceptional 11.3% |