Mongolian vs Immigrants from India Poverty
COMPARE
Mongolian
Immigrants from India
Poverty
Poverty Comparison
Mongolians
Immigrants from India
12.4%
POVERTY
43.6/ 100
METRIC RATING
180th/ 347
METRIC RANK
9.0%
POVERTY
100.0/ 100
METRIC RATING
1st/ 347
METRIC RANK
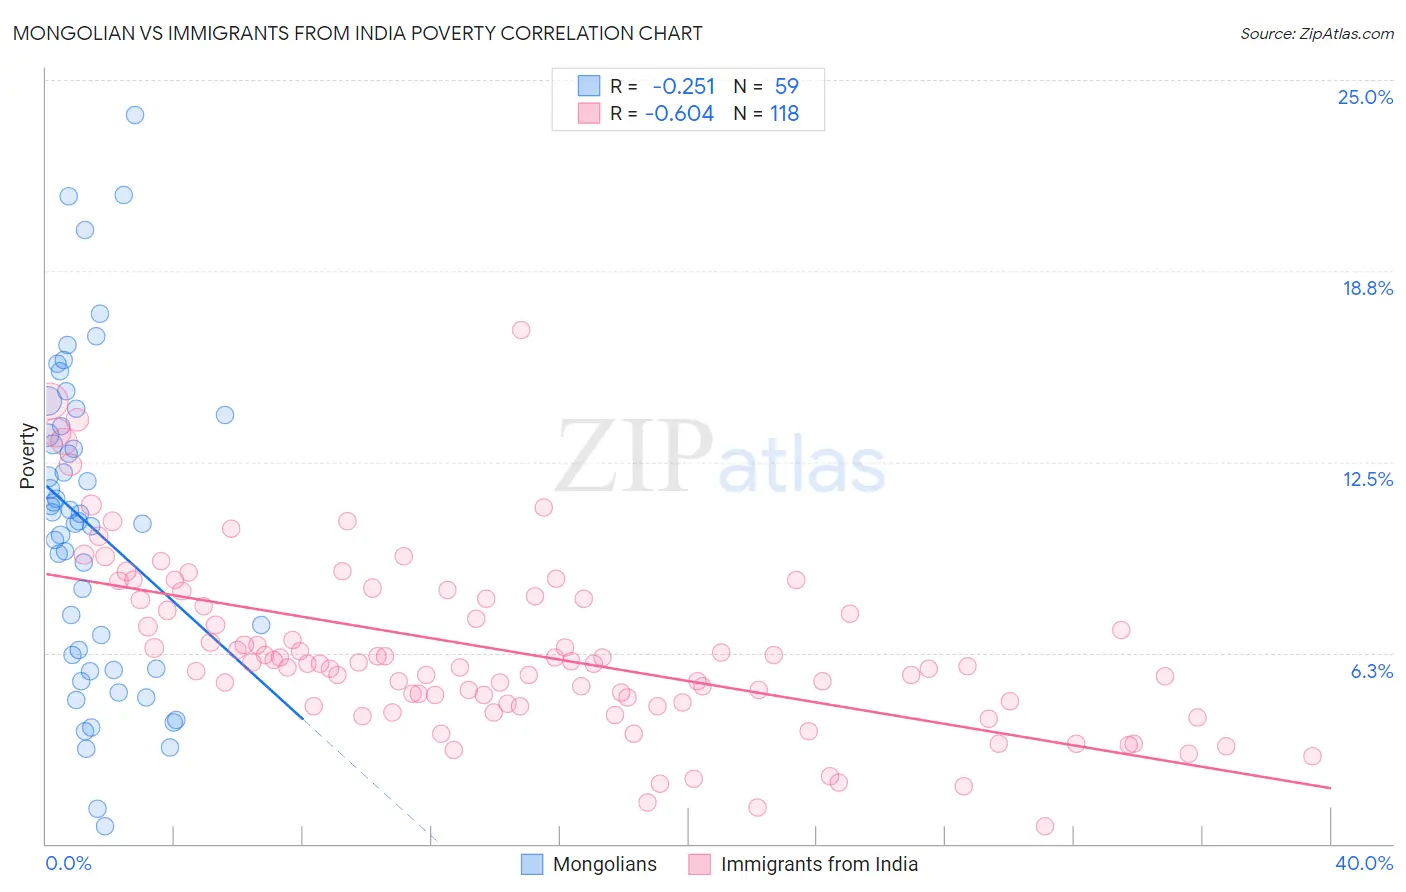
Mongolian vs Immigrants from India Poverty Correlation Chart
The statistical analysis conducted on geographies consisting of 140,290,240 people shows a weak negative correlation between the proportion of Mongolians and poverty level in the United States with a correlation coefficient (R) of -0.251 and weighted average of 12.4%. Similarly, the statistical analysis conducted on geographies consisting of 433,739,641 people shows a significant negative correlation between the proportion of Immigrants from India and poverty level in the United States with a correlation coefficient (R) of -0.604 and weighted average of 9.0%, a difference of 37.1%.
Poverty Correlation Summary
| Measurement | Mongolian | Immigrants from India |
| Minimum | 0.57% | 0.59% |
| Maximum | 23.9% | 16.8% |
| Range | 23.3% | 16.2% |
| Mean | 10.4% | 6.3% |
| Median | 10.6% | 5.9% |
| Interquartile 25% (IQ1) | 5.7% | 4.6% |
| Interquartile 75% (IQ3) | 13.6% | 8.0% |
| Interquartile Range (IQR) | 7.9% | 3.4% |
| Standard Deviation (Sample) | 5.2% | 2.8% |
| Standard Deviation (Population) | 5.1% | 2.8% |
Similar Demographics by Poverty
Demographics Similar to Mongolians by Poverty
In terms of poverty, the demographic groups most similar to Mongolians are Immigrants from Morocco (12.4%, a difference of 0.040%), Uruguayan (12.4%, a difference of 0.10%), Immigrants from Afghanistan (12.4%, a difference of 0.15%), Immigrants from Cameroon (12.4%, a difference of 0.19%), and Immigrants from Iraq (12.4%, a difference of 0.34%).
| Demographics | Rating | Rank | Poverty |
| Celtics | 50.1 /100 | #173 | Average 12.3% |
| Lebanese | 50.0 /100 | #174 | Average 12.3% |
| South Americans | 48.7 /100 | #175 | Average 12.3% |
| Immigrants | Colombia | 47.7 /100 | #176 | Average 12.3% |
| Immigrants | Syria | 47.5 /100 | #177 | Average 12.3% |
| Uruguayans | 44.7 /100 | #178 | Average 12.4% |
| Immigrants | Morocco | 44.0 /100 | #179 | Average 12.4% |
| Mongolians | 43.6 /100 | #180 | Average 12.4% |
| Immigrants | Afghanistan | 42.1 /100 | #181 | Average 12.4% |
| Immigrants | Cameroon | 41.7 /100 | #182 | Average 12.4% |
| Immigrants | Iraq | 40.2 /100 | #183 | Average 12.4% |
| Kenyans | 38.8 /100 | #184 | Fair 12.5% |
| Israelis | 36.4 /100 | #185 | Fair 12.5% |
| Immigrants | Sierra Leone | 36.3 /100 | #186 | Fair 12.5% |
| Hawaiians | 34.1 /100 | #187 | Fair 12.5% |
Demographics Similar to Immigrants from India by Poverty
In terms of poverty, the demographic groups most similar to Immigrants from India are Chinese (9.5%, a difference of 5.6%), Thai (9.6%, a difference of 6.1%), Immigrants from Taiwan (9.7%, a difference of 7.6%), Immigrants from Ireland (10.1%, a difference of 11.6%), and Assyrian/Chaldean/Syriac (10.1%, a difference of 11.8%).
| Demographics | Rating | Rank | Poverty |
| Immigrants | India | 100.0 /100 | #1 | Exceptional 9.0% |
| Chinese | 100.0 /100 | #2 | Exceptional 9.5% |
| Thais | 100.0 /100 | #3 | Exceptional 9.6% |
| Immigrants | Taiwan | 100.0 /100 | #4 | Exceptional 9.7% |
| Immigrants | Ireland | 99.9 /100 | #5 | Exceptional 10.1% |
| Assyrians/Chaldeans/Syriacs | 99.9 /100 | #6 | Exceptional 10.1% |
| Filipinos | 99.9 /100 | #7 | Exceptional 10.1% |
| Maltese | 99.9 /100 | #8 | Exceptional 10.2% |
| Immigrants | South Central Asia | 99.9 /100 | #9 | Exceptional 10.2% |
| Bulgarians | 99.9 /100 | #10 | Exceptional 10.2% |
| Immigrants | Lithuania | 99.9 /100 | #11 | Exceptional 10.3% |
| Bhutanese | 99.8 /100 | #12 | Exceptional 10.4% |
| Immigrants | Hong Kong | 99.8 /100 | #13 | Exceptional 10.4% |
| Immigrants | Bolivia | 99.8 /100 | #14 | Exceptional 10.4% |
| Bolivians | 99.8 /100 | #15 | Exceptional 10.4% |