Immigrants from Uzbekistan vs English Poverty
COMPARE
Immigrants from Uzbekistan
English
Poverty
Poverty Comparison
Immigrants from Uzbekistan
English
13.3%
POVERTY
3.2/ 100
METRIC RATING
217th/ 347
METRIC RANK
11.3%
POVERTY
96.3/ 100
METRIC RATING
84th/ 347
METRIC RANK
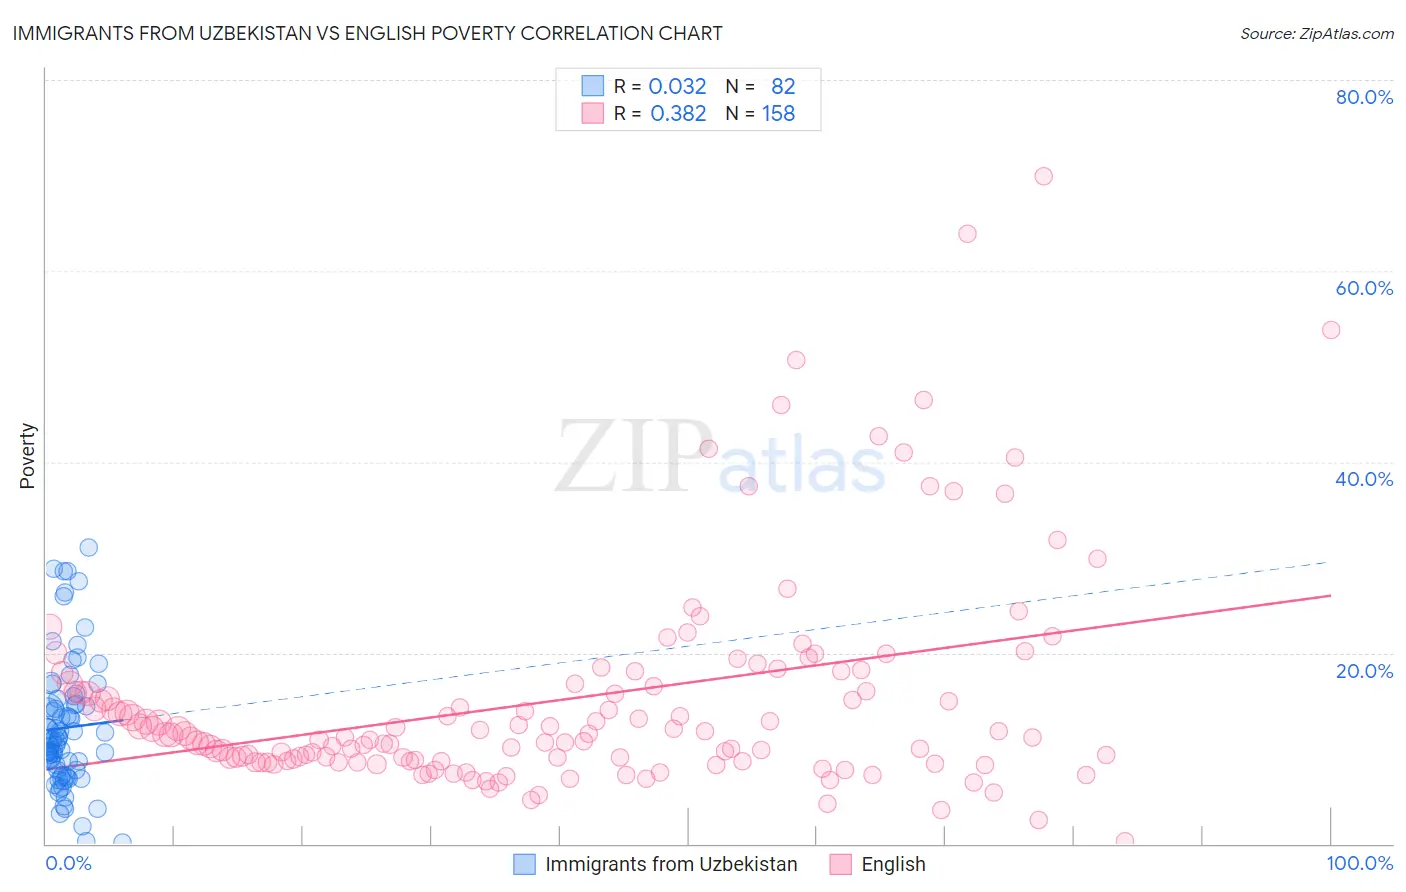
Immigrants from Uzbekistan vs English Poverty Correlation Chart
The statistical analysis conducted on geographies consisting of 118,719,831 people shows no correlation between the proportion of Immigrants from Uzbekistan and poverty level in the United States with a correlation coefficient (R) of 0.032 and weighted average of 13.3%. Similarly, the statistical analysis conducted on geographies consisting of 578,762,394 people shows a mild positive correlation between the proportion of English and poverty level in the United States with a correlation coefficient (R) of 0.382 and weighted average of 11.3%, a difference of 17.5%.
Poverty Correlation Summary
| Measurement | Immigrants from Uzbekistan | English |
| Minimum | 0.14% | 0.27% |
| Maximum | 31.1% | 69.9% |
| Range | 30.9% | 69.6% |
| Mean | 12.2% | 15.1% |
| Median | 10.9% | 11.3% |
| Interquartile 25% (IQ1) | 7.7% | 8.7% |
| Interquartile 75% (IQ3) | 14.7% | 16.7% |
| Interquartile Range (IQR) | 7.0% | 8.0% |
| Standard Deviation (Sample) | 6.7% | 11.3% |
| Standard Deviation (Population) | 6.7% | 11.3% |
Similar Demographics by Poverty
Demographics Similar to Immigrants from Uzbekistan by Poverty
In terms of poverty, the demographic groups most similar to Immigrants from Uzbekistan are Japanese (13.3%, a difference of 0.040%), Nonimmigrants (13.3%, a difference of 0.040%), Immigrants from Thailand (13.3%, a difference of 0.060%), Immigrants from Cambodia (13.4%, a difference of 0.19%), and American (13.4%, a difference of 0.28%).
| Demographics | Rating | Rank | Poverty |
| Immigrants | Azores | 6.1 /100 | #210 | Tragic 13.1% |
| Moroccans | 5.2 /100 | #211 | Tragic 13.2% |
| Immigrants | Immigrants | 4.3 /100 | #212 | Tragic 13.2% |
| Immigrants | Panama | 4.1 /100 | #213 | Tragic 13.3% |
| Bermudans | 3.7 /100 | #214 | Tragic 13.3% |
| Japanese | 3.3 /100 | #215 | Tragic 13.3% |
| Immigrants | Nonimmigrants | 3.3 /100 | #216 | Tragic 13.3% |
| Immigrants | Uzbekistan | 3.2 /100 | #217 | Tragic 13.3% |
| Immigrants | Thailand | 3.1 /100 | #218 | Tragic 13.3% |
| Immigrants | Cambodia | 3.0 /100 | #219 | Tragic 13.4% |
| Americans | 2.9 /100 | #220 | Tragic 13.4% |
| Alsatians | 2.6 /100 | #221 | Tragic 13.4% |
| Immigrants | Micronesia | 2.6 /100 | #222 | Tragic 13.4% |
| Immigrants | Africa | 2.5 /100 | #223 | Tragic 13.4% |
| Immigrants | Eritrea | 2.4 /100 | #224 | Tragic 13.4% |
Demographics Similar to English by Poverty
In terms of poverty, the demographic groups most similar to English are Immigrants from Sweden (11.3%, a difference of 0.010%), Immigrants from England (11.4%, a difference of 0.070%), Jordanian (11.4%, a difference of 0.18%), Egyptian (11.3%, a difference of 0.19%), and Northern European (11.4%, a difference of 0.19%).
| Demographics | Rating | Rank | Poverty |
| Immigrants | Eastern Asia | 96.7 /100 | #77 | Exceptional 11.3% |
| Dutch | 96.7 /100 | #78 | Exceptional 11.3% |
| Cambodians | 96.7 /100 | #79 | Exceptional 11.3% |
| Indians (Asian) | 96.6 /100 | #80 | Exceptional 11.3% |
| Irish | 96.6 /100 | #81 | Exceptional 11.3% |
| Egyptians | 96.5 /100 | #82 | Exceptional 11.3% |
| Immigrants | Sweden | 96.3 /100 | #83 | Exceptional 11.3% |
| English | 96.3 /100 | #84 | Exceptional 11.3% |
| Immigrants | England | 96.2 /100 | #85 | Exceptional 11.4% |
| Jordanians | 96.0 /100 | #86 | Exceptional 11.4% |
| Northern Europeans | 96.0 /100 | #87 | Exceptional 11.4% |
| Belgians | 95.8 /100 | #88 | Exceptional 11.4% |
| Czechoslovakians | 95.7 /100 | #89 | Exceptional 11.4% |
| Immigrants | Denmark | 95.5 /100 | #90 | Exceptional 11.4% |
| Finns | 95.2 /100 | #91 | Exceptional 11.4% |