Immigrants from Uganda vs Central American Child Poverty Among Girls Under 16
COMPARE
Immigrants from Uganda
Central American
Child Poverty Among Girls Under 16
Child Poverty Among Girls Under 16 Comparison
Immigrants from Uganda
Central Americans
16.8%
CHILD POVERTY AMONG GIRLS UNDER 16
31.3/ 100
METRIC RATING
192nd/ 347
METRIC RANK
20.2%
CHILD POVERTY AMONG GIRLS UNDER 16
0.0/ 100
METRIC RATING
281st/ 347
METRIC RANK
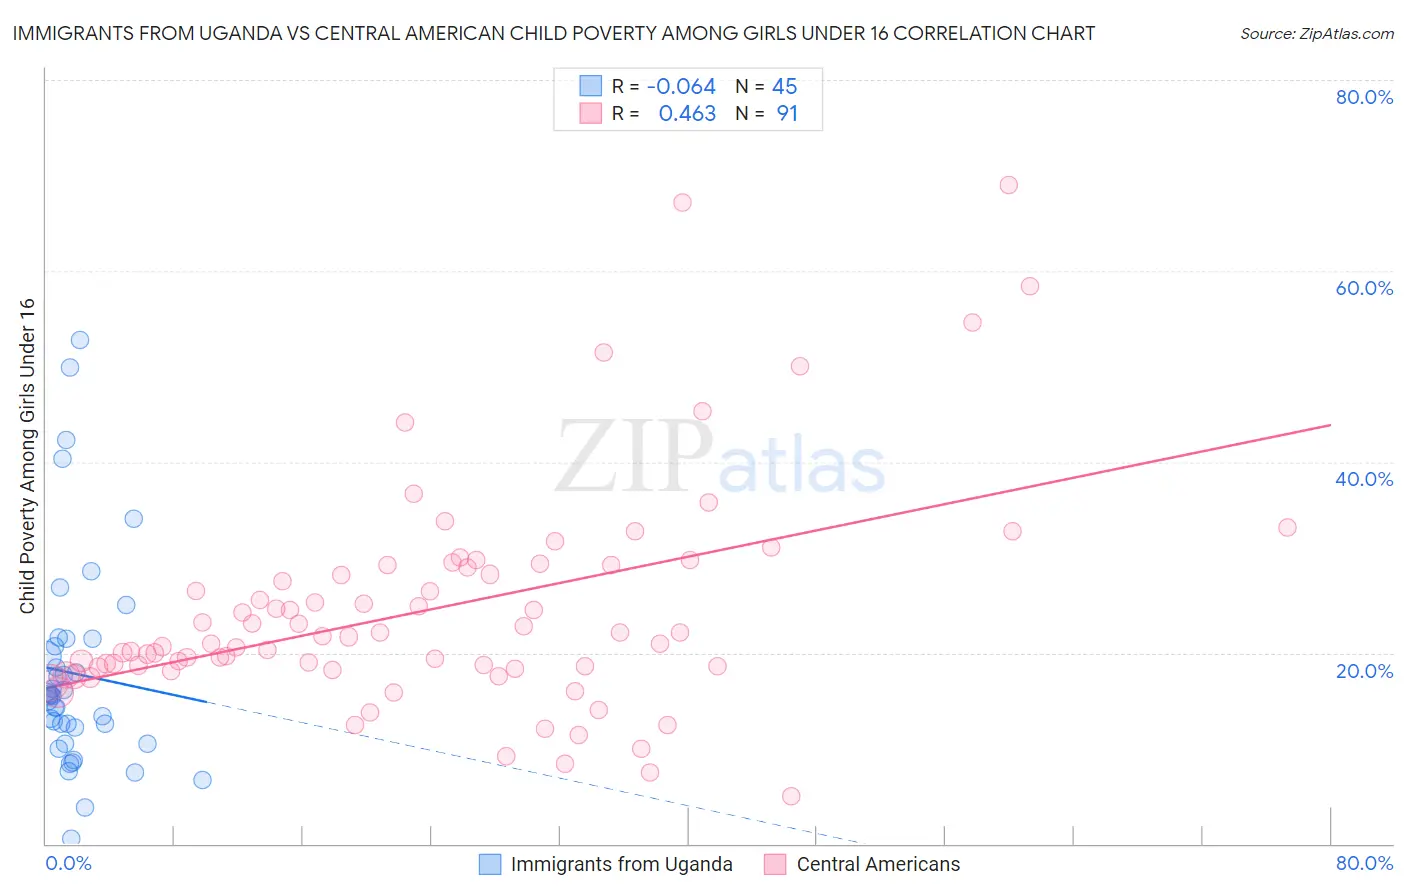
Immigrants from Uganda vs Central American Child Poverty Among Girls Under 16 Correlation Chart
The statistical analysis conducted on geographies consisting of 125,221,716 people shows a slight negative correlation between the proportion of Immigrants from Uganda and poverty level among girls under the age of 16 in the United States with a correlation coefficient (R) of -0.064 and weighted average of 16.8%. Similarly, the statistical analysis conducted on geographies consisting of 492,924,631 people shows a moderate positive correlation between the proportion of Central Americans and poverty level among girls under the age of 16 in the United States with a correlation coefficient (R) of 0.463 and weighted average of 20.2%, a difference of 20.2%.
Child Poverty Among Girls Under 16 Correlation Summary
| Measurement | Immigrants from Uganda | Central American |
| Minimum | 0.57% | 4.9% |
| Maximum | 52.8% | 69.0% |
| Range | 52.2% | 64.1% |
| Mean | 17.8% | 24.6% |
| Median | 15.5% | 21.7% |
| Interquartile 25% (IQ1) | 11.4% | 18.5% |
| Interquartile 75% (IQ3) | 21.0% | 29.2% |
| Interquartile Range (IQR) | 9.7% | 10.7% |
| Standard Deviation (Sample) | 11.1% | 11.7% |
| Standard Deviation (Population) | 11.0% | 11.7% |
Similar Demographics by Child Poverty Among Girls Under 16
Demographics Similar to Immigrants from Uganda by Child Poverty Among Girls Under 16
In terms of child poverty among girls under 16, the demographic groups most similar to Immigrants from Uganda are Immigrants from the Azores (16.8%, a difference of 0.010%), Kenyan (16.8%, a difference of 0.13%), Immigrants from Bosnia and Herzegovina (16.8%, a difference of 0.17%), Aleut (16.9%, a difference of 0.34%), and Spanish (16.9%, a difference of 0.36%).
| Demographics | Rating | Rank | Child Poverty Among Girls Under 16 |
| Immigrants | Uruguay | 35.6 /100 | #185 | Fair 16.7% |
| South American Indians | 35.0 /100 | #186 | Fair 16.8% |
| Immigrants | Morocco | 34.6 /100 | #187 | Fair 16.8% |
| Arabs | 34.5 /100 | #188 | Fair 16.8% |
| Immigrants | Bosnia and Herzegovina | 32.5 /100 | #189 | Fair 16.8% |
| Kenyans | 32.3 /100 | #190 | Fair 16.8% |
| Immigrants | Azores | 31.3 /100 | #191 | Fair 16.8% |
| Immigrants | Uganda | 31.3 /100 | #192 | Fair 16.8% |
| Aleuts | 28.7 /100 | #193 | Fair 16.9% |
| Spanish | 28.6 /100 | #194 | Fair 16.9% |
| Immigrants | Costa Rica | 25.6 /100 | #195 | Fair 17.0% |
| Celtics | 25.2 /100 | #196 | Fair 17.0% |
| Spaniards | 24.9 /100 | #197 | Fair 17.0% |
| Immigrants | Lebanon | 22.6 /100 | #198 | Fair 17.1% |
| Immigrants | Afghanistan | 22.4 /100 | #199 | Fair 17.1% |
Demographics Similar to Central Americans by Child Poverty Among Girls Under 16
In terms of child poverty among girls under 16, the demographic groups most similar to Central Americans are Immigrants from Liberia (20.2%, a difference of 0.070%), Immigrants from Zaire (20.2%, a difference of 0.080%), Barbadian (20.2%, a difference of 0.21%), Belizean (20.2%, a difference of 0.24%), and West Indian (20.3%, a difference of 0.28%).
| Demographics | Rating | Rank | Child Poverty Among Girls Under 16 |
| Immigrants | St. Vincent and the Grenadines | 0.0 /100 | #274 | Tragic 20.1% |
| Sub-Saharan Africans | 0.0 /100 | #275 | Tragic 20.1% |
| Comanche | 0.0 /100 | #276 | Tragic 20.2% |
| Belizeans | 0.0 /100 | #277 | Tragic 20.2% |
| Barbadians | 0.0 /100 | #278 | Tragic 20.2% |
| Immigrants | Zaire | 0.0 /100 | #279 | Tragic 20.2% |
| Immigrants | Liberia | 0.0 /100 | #280 | Tragic 20.2% |
| Central Americans | 0.0 /100 | #281 | Tragic 20.2% |
| West Indians | 0.0 /100 | #282 | Tragic 20.3% |
| Senegalese | 0.0 /100 | #283 | Tragic 20.3% |
| Yaqui | 0.0 /100 | #284 | Tragic 20.3% |
| Immigrants | Cabo Verde | 0.0 /100 | #285 | Tragic 20.3% |
| Iroquois | 0.0 /100 | #286 | Tragic 20.4% |
| Blackfeet | 0.0 /100 | #287 | Tragic 20.5% |
| Haitians | 0.0 /100 | #288 | Tragic 20.5% |