Guatemalan vs Sioux Child Poverty Among Girls Under 16
COMPARE
Guatemalan
Sioux
Child Poverty Among Girls Under 16
Child Poverty Among Girls Under 16 Comparison
Guatemalans
Sioux
21.4%
CHILD POVERTY AMONG GIRLS UNDER 16
0.0/ 100
METRIC RATING
305th/ 347
METRIC RANK
25.6%
CHILD POVERTY AMONG GIRLS UNDER 16
0.0/ 100
METRIC RATING
336th/ 347
METRIC RANK
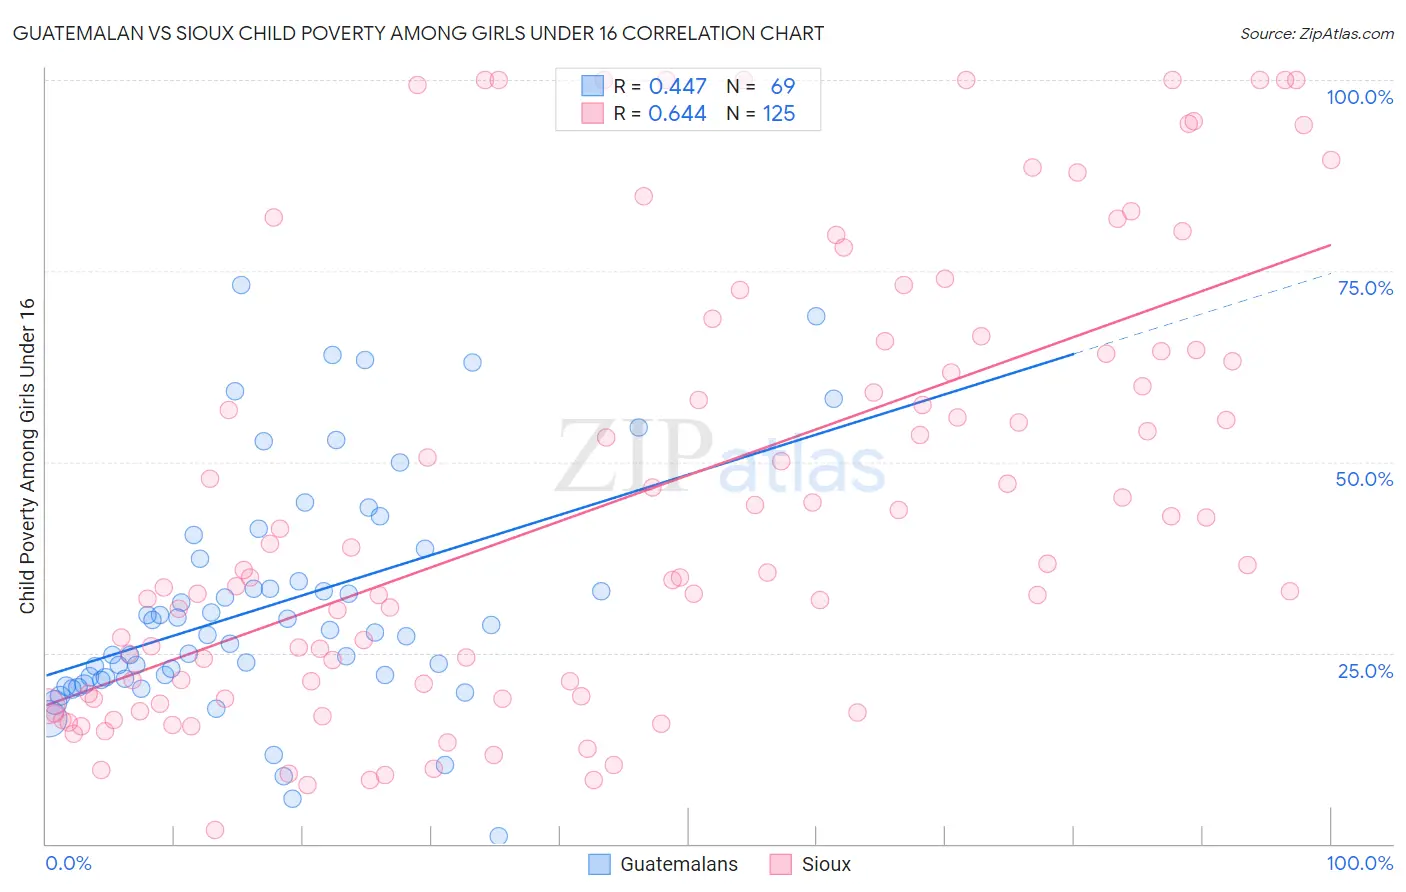
Guatemalan vs Sioux Child Poverty Among Girls Under 16 Correlation Chart
The statistical analysis conducted on geographies consisting of 404,016,848 people shows a moderate positive correlation between the proportion of Guatemalans and poverty level among girls under the age of 16 in the United States with a correlation coefficient (R) of 0.447 and weighted average of 21.4%. Similarly, the statistical analysis conducted on geographies consisting of 231,838,275 people shows a significant positive correlation between the proportion of Sioux and poverty level among girls under the age of 16 in the United States with a correlation coefficient (R) of 0.644 and weighted average of 25.6%, a difference of 19.5%.
Child Poverty Among Girls Under 16 Correlation Summary
| Measurement | Guatemalan | Sioux |
| Minimum | 1.1% | 1.8% |
| Maximum | 73.2% | 100.0% |
| Range | 72.1% | 98.2% |
| Mean | 31.3% | 45.0% |
| Median | 27.6% | 35.9% |
| Interquartile 25% (IQ1) | 21.7% | 19.5% |
| Interquartile 75% (IQ3) | 37.9% | 64.6% |
| Interquartile Range (IQR) | 16.2% | 45.1% |
| Standard Deviation (Sample) | 15.3% | 28.8% |
| Standard Deviation (Population) | 15.2% | 28.7% |
Similar Demographics by Child Poverty Among Girls Under 16
Demographics Similar to Guatemalans by Child Poverty Among Girls Under 16
In terms of child poverty among girls under 16, the demographic groups most similar to Guatemalans are Immigrants from Central America (21.4%, a difference of 0.17%), Immigrants from Bahamas (21.4%, a difference of 0.18%), Houma (21.5%, a difference of 0.36%), Bahamian (21.5%, a difference of 0.48%), and Indonesian (21.3%, a difference of 0.62%).
| Demographics | Rating | Rank | Child Poverty Among Girls Under 16 |
| Mexicans | 0.0 /100 | #298 | Tragic 20.9% |
| Hispanics or Latinos | 0.0 /100 | #299 | Tragic 21.0% |
| Somalis | 0.0 /100 | #300 | Tragic 21.0% |
| Choctaw | 0.0 /100 | #301 | Tragic 21.1% |
| Seminole | 0.0 /100 | #302 | Tragic 21.2% |
| British West Indians | 0.0 /100 | #303 | Tragic 21.3% |
| Indonesians | 0.0 /100 | #304 | Tragic 21.3% |
| Guatemalans | 0.0 /100 | #305 | Tragic 21.4% |
| Immigrants | Central America | 0.0 /100 | #306 | Tragic 21.4% |
| Immigrants | Bahamas | 0.0 /100 | #307 | Tragic 21.4% |
| Houma | 0.0 /100 | #308 | Tragic 21.5% |
| Bahamians | 0.0 /100 | #309 | Tragic 21.5% |
| Immigrants | Somalia | 0.0 /100 | #310 | Tragic 21.6% |
| Dutch West Indians | 0.0 /100 | #311 | Tragic 21.6% |
| Immigrants | Mexico | 0.0 /100 | #312 | Tragic 21.6% |
Demographics Similar to Sioux by Child Poverty Among Girls Under 16
In terms of child poverty among girls under 16, the demographic groups most similar to Sioux are Yup'ik (25.8%, a difference of 0.93%), Pueblo (25.2%, a difference of 1.5%), Menominee (25.0%, a difference of 2.2%), Cheyenne (26.3%, a difference of 2.7%), and Crow (26.4%, a difference of 3.1%).
| Demographics | Rating | Rank | Child Poverty Among Girls Under 16 |
| Kiowa | 0.0 /100 | #329 | Tragic 23.7% |
| Immigrants | Dominican Republic | 0.0 /100 | #330 | Tragic 23.8% |
| Apache | 0.0 /100 | #331 | Tragic 23.8% |
| Natives/Alaskans | 0.0 /100 | #332 | Tragic 24.0% |
| Blacks/African Americans | 0.0 /100 | #333 | Tragic 24.7% |
| Menominee | 0.0 /100 | #334 | Tragic 25.0% |
| Pueblo | 0.0 /100 | #335 | Tragic 25.2% |
| Sioux | 0.0 /100 | #336 | Tragic 25.6% |
| Yup'ik | 0.0 /100 | #337 | Tragic 25.8% |
| Cheyenne | 0.0 /100 | #338 | Tragic 26.3% |
| Crow | 0.0 /100 | #339 | Tragic 26.4% |
| Yuman | 0.0 /100 | #340 | Tragic 27.1% |
| Hopi | 0.0 /100 | #341 | Tragic 27.9% |
| Pima | 0.0 /100 | #342 | Tragic 28.2% |
| Immigrants | Yemen | 0.0 /100 | #343 | Tragic 29.5% |