Immigrants from Turkey vs German Russian 2nd Grade
COMPARE
Immigrants from Turkey
German Russian
2nd Grade
2nd Grade Comparison
Immigrants from Turkey
German Russians
98.0%
2ND GRADE
83.0/ 100
METRIC RATING
141st/ 347
METRIC RANK
98.1%
2ND GRADE
97.4/ 100
METRIC RATING
107th/ 347
METRIC RANK
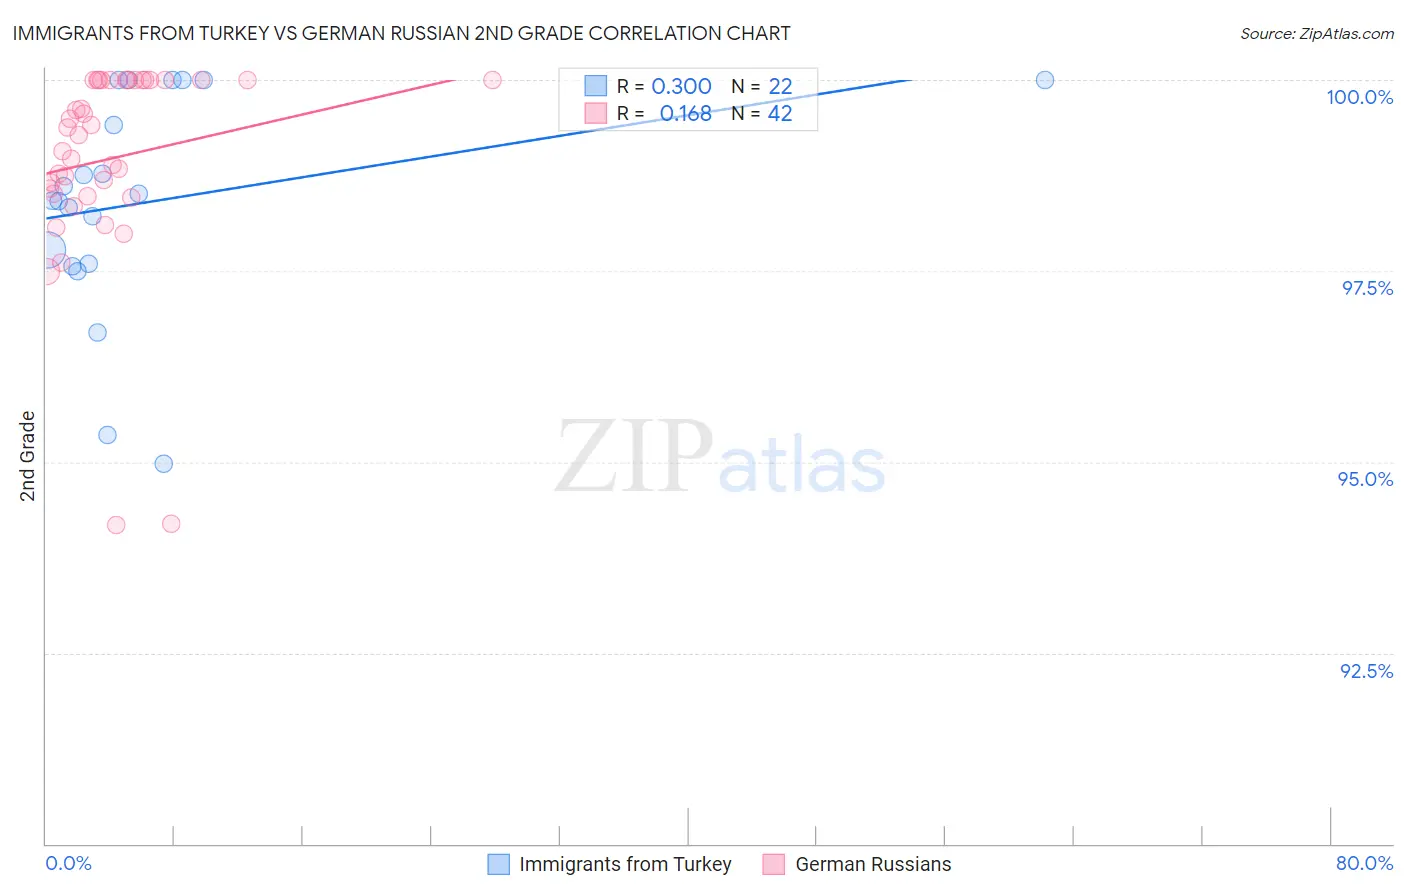
Immigrants from Turkey vs German Russian 2nd Grade Correlation Chart
The statistical analysis conducted on geographies consisting of 223,057,877 people shows a mild positive correlation between the proportion of Immigrants from Turkey and percentage of population with at least 2nd grade education in the United States with a correlation coefficient (R) of 0.300 and weighted average of 98.0%. Similarly, the statistical analysis conducted on geographies consisting of 96,461,520 people shows a poor positive correlation between the proportion of German Russians and percentage of population with at least 2nd grade education in the United States with a correlation coefficient (R) of 0.168 and weighted average of 98.1%, a difference of 0.16%.
2nd Grade Correlation Summary
| Measurement | Immigrants from Turkey | German Russian |
| Minimum | 95.0% | 94.2% |
| Maximum | 100.0% | 100.0% |
| Range | 5.0% | 5.8% |
| Mean | 98.4% | 99.0% |
| Median | 98.5% | 99.3% |
| Interquartile 25% (IQ1) | 97.6% | 98.5% |
| Interquartile 75% (IQ3) | 100.0% | 100.0% |
| Interquartile Range (IQR) | 2.4% | 1.5% |
| Standard Deviation (Sample) | 1.4% | 1.3% |
| Standard Deviation (Population) | 1.4% | 1.3% |
Similar Demographics by 2nd Grade
Demographics Similar to Immigrants from Turkey by 2nd Grade
In terms of 2nd grade, the demographic groups most similar to Immigrants from Turkey are Palestinian (98.0%, a difference of 0.010%), Burmese (98.0%, a difference of 0.010%), Alsatian (98.0%, a difference of 0.010%), Hmong (98.0%, a difference of 0.020%), and Filipino (98.0%, a difference of 0.020%).
| Demographics | Rating | Rank | 2nd Grade |
| Immigrants | Hungary | 89.7 /100 | #134 | Excellent 98.0% |
| Immigrants | Bulgaria | 89.7 /100 | #135 | Excellent 98.0% |
| Immigrants | Kuwait | 89.2 /100 | #136 | Excellent 98.0% |
| Immigrants | Romania | 88.3 /100 | #137 | Excellent 98.0% |
| Israelis | 87.9 /100 | #138 | Excellent 98.0% |
| Blackfeet | 87.5 /100 | #139 | Excellent 98.0% |
| Palestinians | 83.9 /100 | #140 | Excellent 98.0% |
| Immigrants | Turkey | 83.0 /100 | #141 | Excellent 98.0% |
| Burmese | 81.0 /100 | #142 | Excellent 98.0% |
| Alsatians | 80.5 /100 | #143 | Excellent 98.0% |
| Hmong | 80.0 /100 | #144 | Good 98.0% |
| Filipinos | 79.2 /100 | #145 | Good 98.0% |
| Immigrants | Israel | 78.0 /100 | #146 | Good 98.0% |
| Immigrants | Greece | 76.8 /100 | #147 | Good 98.0% |
| Jordanians | 74.5 /100 | #148 | Good 98.0% |
Demographics Similar to German Russians by 2nd Grade
In terms of 2nd grade, the demographic groups most similar to German Russians are Turkish (98.2%, a difference of 0.0%), Yugoslavian (98.2%, a difference of 0.0%), Bhutanese (98.1%, a difference of 0.0%), Immigrants from Switzerland (98.1%, a difference of 0.0%), and Pima (98.2%, a difference of 0.010%).
| Demographics | Rating | Rank | 2nd Grade |
| Romanians | 98.0 /100 | #100 | Exceptional 98.2% |
| Puget Sound Salish | 98.0 /100 | #101 | Exceptional 98.2% |
| Cree | 98.0 /100 | #102 | Exceptional 98.2% |
| Pima | 97.6 /100 | #103 | Exceptional 98.2% |
| Turks | 97.6 /100 | #104 | Exceptional 98.2% |
| Yugoslavians | 97.5 /100 | #105 | Exceptional 98.2% |
| Bhutanese | 97.5 /100 | #106 | Exceptional 98.1% |
| German Russians | 97.4 /100 | #107 | Exceptional 98.1% |
| Immigrants | Switzerland | 97.3 /100 | #108 | Exceptional 98.1% |
| Basques | 97.2 /100 | #109 | Exceptional 98.1% |
| Immigrants | Singapore | 97.0 /100 | #110 | Exceptional 98.1% |
| Immigrants | Czechoslovakia | 96.9 /100 | #111 | Exceptional 98.1% |
| Colville | 96.6 /100 | #112 | Exceptional 98.1% |
| Immigrants | Norway | 96.5 /100 | #113 | Exceptional 98.1% |
| Immigrants | Latvia | 96.4 /100 | #114 | Exceptional 98.1% |