Kiowa vs German Russian Single Male Poverty
COMPARE
Kiowa
German Russian
Single Male Poverty
Single Male Poverty Comparison
Kiowa
German Russians
18.3%
SINGLE MALE POVERTY
0.0/ 100
METRIC RATING
328th/ 347
METRIC RANK
13.6%
SINGLE MALE POVERTY
0.8/ 100
METRIC RATING
253rd/ 347
METRIC RANK
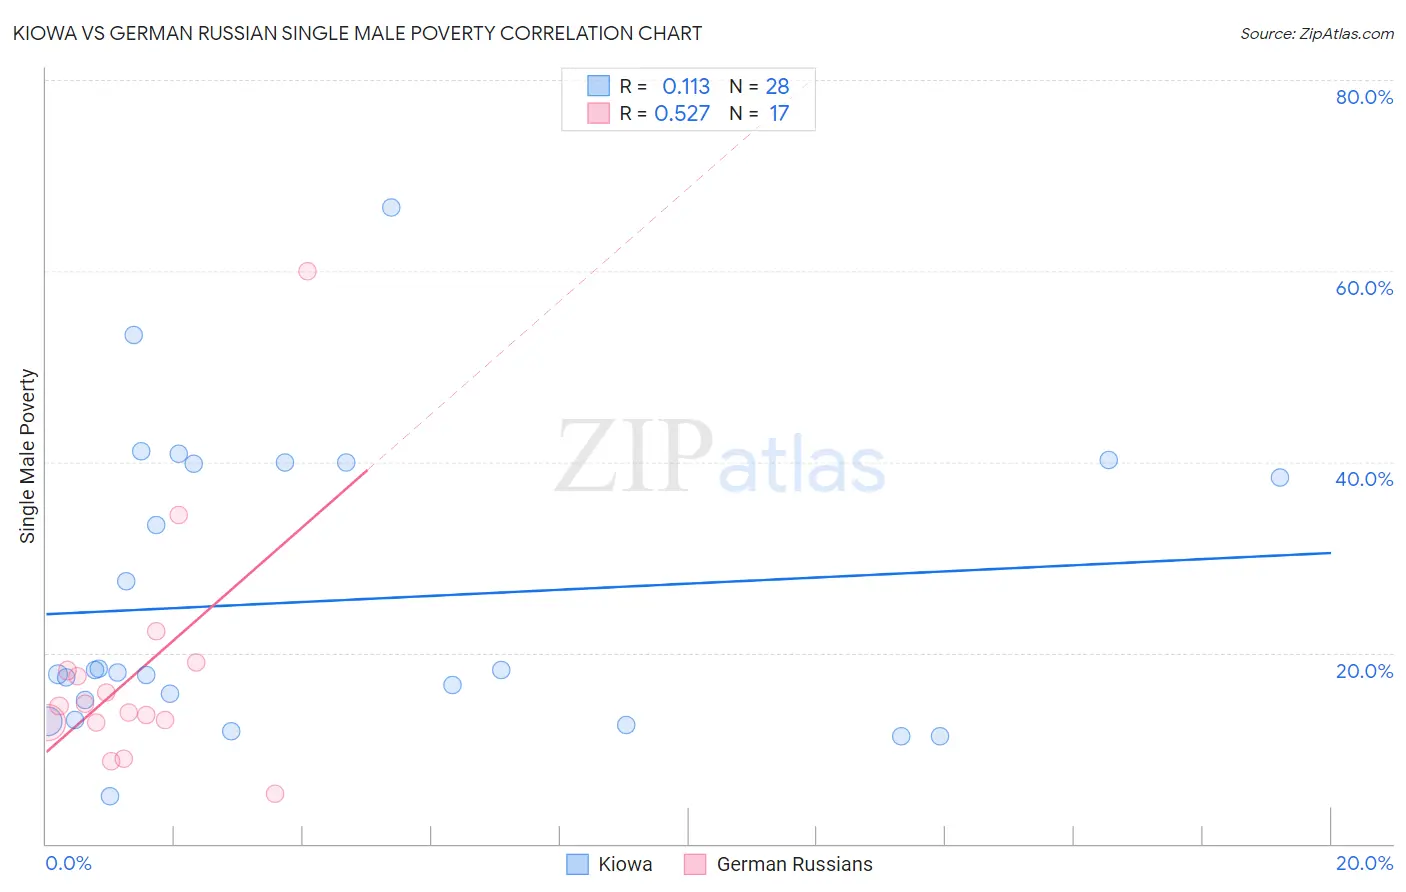
Kiowa vs German Russian Single Male Poverty Correlation Chart
The statistical analysis conducted on geographies consisting of 54,682,389 people shows a poor positive correlation between the proportion of Kiowa and poverty level among single males in the United States with a correlation coefficient (R) of 0.113 and weighted average of 18.3%. Similarly, the statistical analysis conducted on geographies consisting of 92,578,425 people shows a substantial positive correlation between the proportion of German Russians and poverty level among single males in the United States with a correlation coefficient (R) of 0.527 and weighted average of 13.6%, a difference of 34.4%.
Single Male Poverty Correlation Summary
| Measurement | Kiowa | German Russian |
| Minimum | 5.0% | 5.3% |
| Maximum | 66.7% | 60.0% |
| Range | 61.7% | 54.7% |
| Mean | 25.4% | 17.9% |
| Median | 18.1% | 14.4% |
| Interquartile 25% (IQ1) | 14.0% | 12.8% |
| Interquartile 75% (IQ3) | 39.9% | 18.6% |
| Interquartile Range (IQR) | 25.9% | 5.8% |
| Standard Deviation (Sample) | 15.2% | 12.6% |
| Standard Deviation (Population) | 14.9% | 12.2% |
Similar Demographics by Single Male Poverty
Demographics Similar to Kiowa by Single Male Poverty
In terms of single male poverty, the demographic groups most similar to Kiowa are Colville (18.4%, a difference of 0.73%), Menominee (17.7%, a difference of 3.3%), Cajun (19.1%, a difference of 4.2%), Paiute (19.3%, a difference of 5.4%), and Central American Indian (17.2%, a difference of 6.1%).
| Demographics | Rating | Rank | Single Male Poverty |
| Osage | 0.0 /100 | #321 | Tragic 16.5% |
| Shoshone | 0.0 /100 | #322 | Tragic 16.7% |
| Creek | 0.0 /100 | #323 | Tragic 16.8% |
| Immigrants | Yemen | 0.0 /100 | #324 | Tragic 16.9% |
| Choctaw | 0.0 /100 | #325 | Tragic 17.0% |
| Central American Indians | 0.0 /100 | #326 | Tragic 17.2% |
| Menominee | 0.0 /100 | #327 | Tragic 17.7% |
| Kiowa | 0.0 /100 | #328 | Tragic 18.3% |
| Colville | 0.0 /100 | #329 | Tragic 18.4% |
| Cajuns | 0.0 /100 | #330 | Tragic 19.1% |
| Paiute | 0.0 /100 | #331 | Tragic 19.3% |
| Natives/Alaskans | 0.0 /100 | #332 | Tragic 19.6% |
| Inupiat | 0.0 /100 | #333 | Tragic 20.0% |
| Pima | 0.0 /100 | #334 | Tragic 20.2% |
| Yuman | 0.0 /100 | #335 | Tragic 21.3% |
Demographics Similar to German Russians by Single Male Poverty
In terms of single male poverty, the demographic groups most similar to German Russians are Finnish (13.6%, a difference of 0.14%), Immigrants from Zaire (13.6%, a difference of 0.19%), Immigrants from Somalia (13.6%, a difference of 0.30%), Spanish (13.6%, a difference of 0.32%), and Czech (13.5%, a difference of 0.56%).
| Demographics | Rating | Rank | Single Male Poverty |
| Immigrants | Micronesia | 1.2 /100 | #246 | Tragic 13.5% |
| Belgians | 1.2 /100 | #247 | Tragic 13.5% |
| Czechs | 1.2 /100 | #248 | Tragic 13.5% |
| Spanish | 1.0 /100 | #249 | Tragic 13.6% |
| Immigrants | Somalia | 1.0 /100 | #250 | Tragic 13.6% |
| Immigrants | Zaire | 0.9 /100 | #251 | Tragic 13.6% |
| Finns | 0.9 /100 | #252 | Tragic 13.6% |
| German Russians | 0.8 /100 | #253 | Tragic 13.6% |
| Sub-Saharan Africans | 0.5 /100 | #254 | Tragic 13.7% |
| Spaniards | 0.4 /100 | #255 | Tragic 13.7% |
| Immigrants | Belize | 0.4 /100 | #256 | Tragic 13.7% |
| Immigrants | Central America | 0.3 /100 | #257 | Tragic 13.8% |
| Immigrants | Guatemala | 0.3 /100 | #258 | Tragic 13.8% |
| Guatemalans | 0.3 /100 | #259 | Tragic 13.8% |
| Swiss | 0.3 /100 | #260 | Tragic 13.8% |