Immigrants from Turkey vs Immigrants from Switzerland Poverty
COMPARE
Immigrants from Turkey
Immigrants from Switzerland
Poverty
Poverty Comparison
Immigrants from Turkey
Immigrants from Switzerland
11.6%
POVERTY
91.7/ 100
METRIC RATING
109th/ 347
METRIC RANK
11.8%
POVERTY
83.0/ 100
METRIC RATING
137th/ 347
METRIC RANK
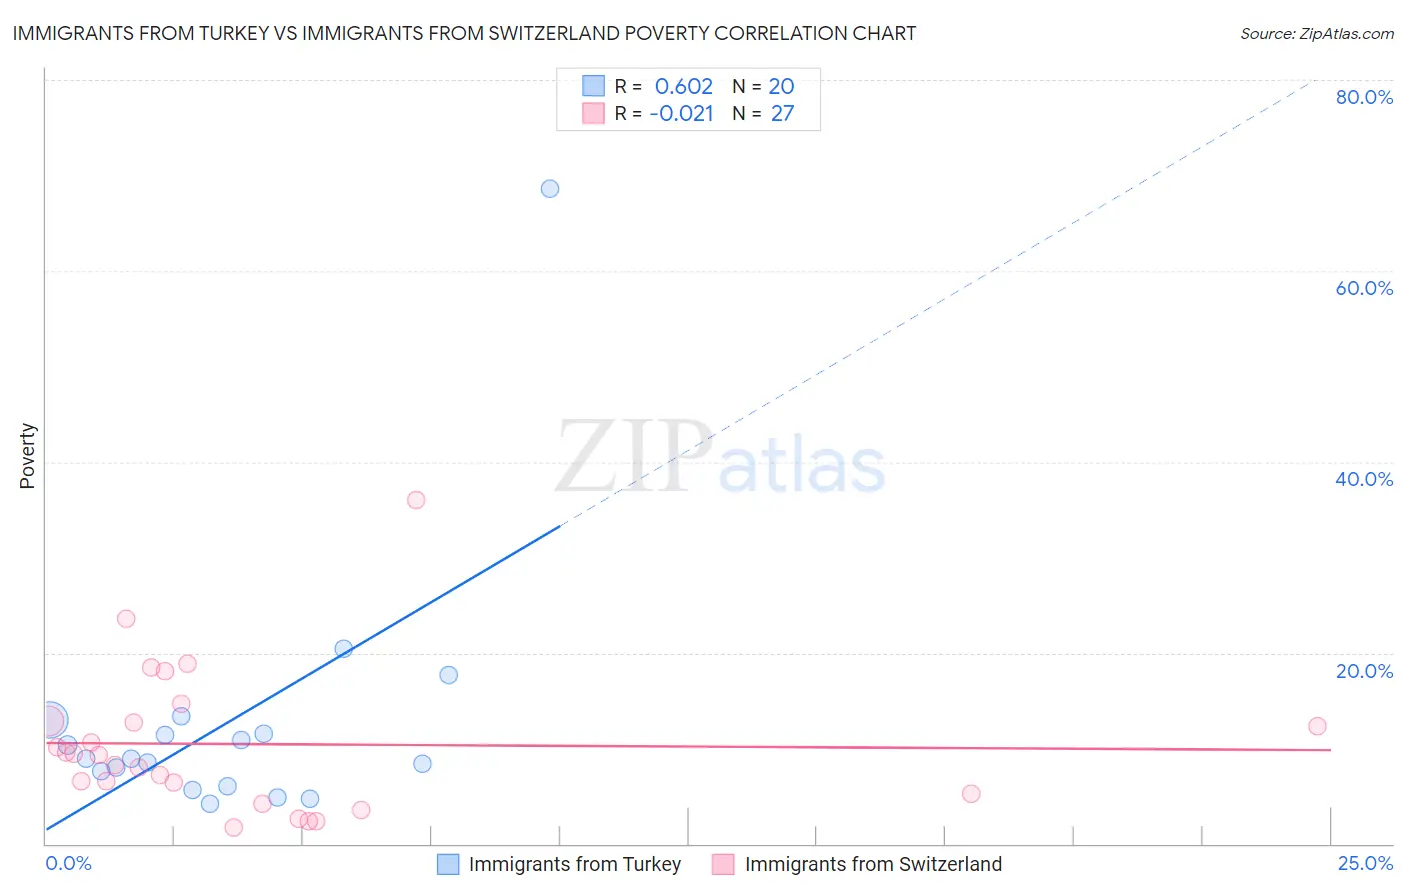
Immigrants from Turkey vs Immigrants from Switzerland Poverty Correlation Chart
The statistical analysis conducted on geographies consisting of 222,977,543 people shows a significant positive correlation between the proportion of Immigrants from Turkey and poverty level in the United States with a correlation coefficient (R) of 0.602 and weighted average of 11.6%. Similarly, the statistical analysis conducted on geographies consisting of 148,064,410 people shows no correlation between the proportion of Immigrants from Switzerland and poverty level in the United States with a correlation coefficient (R) of -0.021 and weighted average of 11.8%, a difference of 2.1%.
Poverty Correlation Summary
| Measurement | Immigrants from Turkey | Immigrants from Switzerland |
| Minimum | 4.2% | 1.7% |
| Maximum | 68.6% | 36.1% |
| Range | 64.4% | 34.3% |
| Mean | 12.6% | 10.4% |
| Median | 8.9% | 9.3% |
| Interquartile 25% (IQ1) | 6.8% | 5.3% |
| Interquartile 75% (IQ3) | 12.3% | 12.8% |
| Interquartile Range (IQR) | 5.4% | 7.6% |
| Standard Deviation (Sample) | 13.8% | 7.6% |
| Standard Deviation (Population) | 13.5% | 7.5% |
Similar Demographics by Poverty
Demographics Similar to Immigrants from Turkey by Poverty
In terms of poverty, the demographic groups most similar to Immigrants from Turkey are Canadian (11.6%, a difference of 0.010%), Welsh (11.6%, a difference of 0.040%), Palestinian (11.6%, a difference of 0.050%), Portuguese (11.6%, a difference of 0.14%), and Immigrants from Zimbabwe (11.6%, a difference of 0.14%).
| Demographics | Rating | Rank | Poverty |
| Laotians | 92.4 /100 | #102 | Exceptional 11.6% |
| Okinawans | 92.4 /100 | #103 | Exceptional 11.6% |
| Native Hawaiians | 92.1 /100 | #104 | Exceptional 11.6% |
| Portuguese | 92.1 /100 | #105 | Exceptional 11.6% |
| Immigrants | Zimbabwe | 92.1 /100 | #106 | Exceptional 11.6% |
| Palestinians | 91.8 /100 | #107 | Exceptional 11.6% |
| Canadians | 91.7 /100 | #108 | Exceptional 11.6% |
| Immigrants | Turkey | 91.7 /100 | #109 | Exceptional 11.6% |
| Welsh | 91.6 /100 | #110 | Exceptional 11.6% |
| French Canadians | 91.0 /100 | #111 | Exceptional 11.6% |
| Immigrants | Southern Europe | 90.8 /100 | #112 | Exceptional 11.6% |
| Immigrants | Belarus | 90.8 /100 | #113 | Exceptional 11.6% |
| Immigrants | China | 90.7 /100 | #114 | Exceptional 11.6% |
| Albanians | 90.3 /100 | #115 | Exceptional 11.7% |
| Immigrants | Russia | 89.7 /100 | #116 | Excellent 11.7% |
Demographics Similar to Immigrants from Switzerland by Poverty
In terms of poverty, the demographic groups most similar to Immigrants from Switzerland are Immigrants from Jordan (11.9%, a difference of 0.11%), Pakistani (11.9%, a difference of 0.14%), Chilean (11.8%, a difference of 0.21%), Immigrants from Peru (11.9%, a difference of 0.33%), and Immigrants from Vietnam (11.8%, a difference of 0.41%).
| Demographics | Rating | Rank | Poverty |
| Immigrants | Ukraine | 86.6 /100 | #130 | Excellent 11.8% |
| French | 86.1 /100 | #131 | Excellent 11.8% |
| Peruvians | 85.6 /100 | #132 | Excellent 11.8% |
| Immigrants | Western Europe | 85.2 /100 | #133 | Excellent 11.8% |
| Yugoslavians | 85.2 /100 | #134 | Excellent 11.8% |
| Immigrants | Vietnam | 85.2 /100 | #135 | Excellent 11.8% |
| Chileans | 84.2 /100 | #136 | Excellent 11.8% |
| Immigrants | Switzerland | 83.0 /100 | #137 | Excellent 11.8% |
| Immigrants | Jordan | 82.4 /100 | #138 | Excellent 11.9% |
| Pakistanis | 82.2 /100 | #139 | Excellent 11.9% |
| Immigrants | Peru | 81.1 /100 | #140 | Excellent 11.9% |
| Immigrants | France | 80.5 /100 | #141 | Excellent 11.9% |
| Basques | 80.4 /100 | #142 | Excellent 11.9% |
| Brazilians | 79.7 /100 | #143 | Good 11.9% |
| Icelanders | 77.9 /100 | #144 | Good 11.9% |