Immigrants from Turkey vs African In Labor Force | Age 25-29
COMPARE
Immigrants from Turkey
African
In Labor Force | Age 25-29
In Labor Force | Age 25-29 Comparison
Immigrants from Turkey
Africans
85.4%
IN LABOR FORCE | AGE 25-29
99.2/ 100
METRIC RATING
67th/ 347
METRIC RANK
83.2%
IN LABOR FORCE | AGE 25-29
0.0/ 100
METRIC RATING
277th/ 347
METRIC RANK
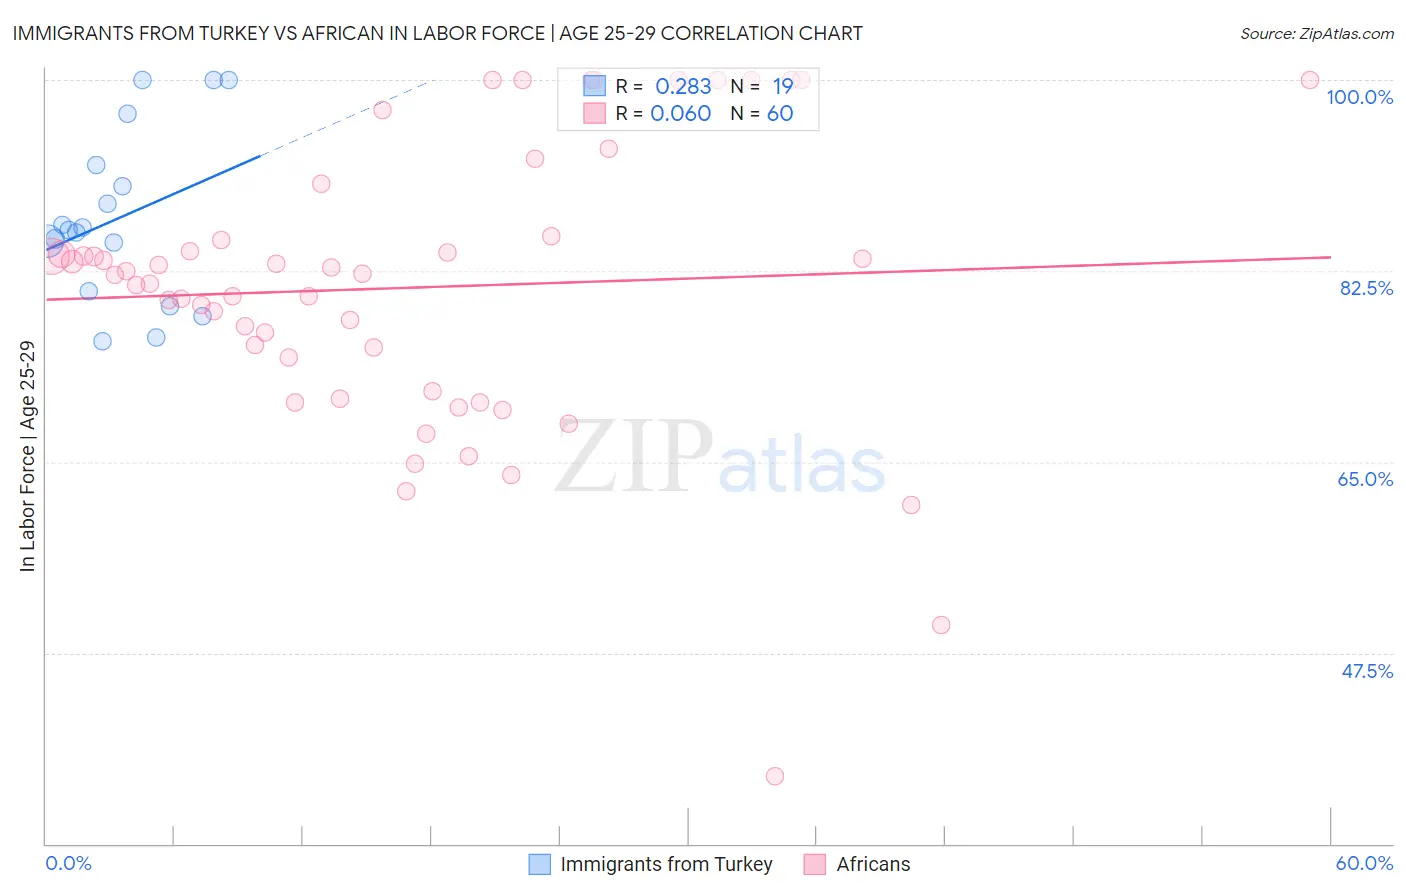
Immigrants from Turkey vs African In Labor Force | Age 25-29 Correlation Chart
The statistical analysis conducted on geographies consisting of 223,033,293 people shows a weak positive correlation between the proportion of Immigrants from Turkey and labor force participation rate among population between the ages 25 and 29 in the United States with a correlation coefficient (R) of 0.283 and weighted average of 85.4%. Similarly, the statistical analysis conducted on geographies consisting of 469,793,386 people shows a slight positive correlation between the proportion of Africans and labor force participation rate among population between the ages 25 and 29 in the United States with a correlation coefficient (R) of 0.060 and weighted average of 83.2%, a difference of 2.6%.
In Labor Force | Age 25-29 Correlation Summary
| Measurement | Immigrants from Turkey | African |
| Minimum | 76.1% | 36.2% |
| Maximum | 100.0% | 100.0% |
| Range | 23.9% | 63.8% |
| Mean | 87.4% | 81.0% |
| Median | 86.2% | 82.2% |
| Interquartile 25% (IQ1) | 80.6% | 73.0% |
| Interquartile 75% (IQ3) | 92.2% | 85.5% |
| Interquartile Range (IQR) | 11.6% | 12.5% |
| Standard Deviation (Sample) | 7.7% | 13.1% |
| Standard Deviation (Population) | 7.5% | 12.9% |
Similar Demographics by In Labor Force | Age 25-29
Demographics Similar to Immigrants from Turkey by In Labor Force | Age 25-29
In terms of in labor force | age 25-29, the demographic groups most similar to Immigrants from Turkey are Immigrants from Scotland (85.4%, a difference of 0.010%), Immigrants from Cameroon (85.4%, a difference of 0.010%), Immigrants from Italy (85.4%, a difference of 0.020%), Immigrants from Czechoslovakia (85.4%, a difference of 0.020%), and Menominee (85.4%, a difference of 0.030%).
| Demographics | Rating | Rank | In Labor Force | Age 25-29 |
| Thais | 99.5 /100 | #60 | Exceptional 85.5% |
| Serbians | 99.5 /100 | #61 | Exceptional 85.5% |
| Taiwanese | 99.4 /100 | #62 | Exceptional 85.4% |
| Immigrants | Kenya | 99.4 /100 | #63 | Exceptional 85.4% |
| Immigrants | Italy | 99.3 /100 | #64 | Exceptional 85.4% |
| Immigrants | Czechoslovakia | 99.3 /100 | #65 | Exceptional 85.4% |
| Immigrants | Scotland | 99.3 /100 | #66 | Exceptional 85.4% |
| Immigrants | Turkey | 99.2 /100 | #67 | Exceptional 85.4% |
| Immigrants | Cameroon | 99.2 /100 | #68 | Exceptional 85.4% |
| Menominee | 99.1 /100 | #69 | Exceptional 85.4% |
| Immigrants | Sweden | 99.1 /100 | #70 | Exceptional 85.4% |
| Kenyans | 99.0 /100 | #71 | Exceptional 85.4% |
| Immigrants | Australia | 98.9 /100 | #72 | Exceptional 85.3% |
| Russians | 98.8 /100 | #73 | Exceptional 85.3% |
| Soviet Union | 98.5 /100 | #74 | Exceptional 85.3% |
Demographics Similar to Africans by In Labor Force | Age 25-29
In terms of in labor force | age 25-29, the demographic groups most similar to Africans are Immigrants from Cuba (83.2%, a difference of 0.050%), British West Indian (83.2%, a difference of 0.060%), Samoan (83.3%, a difference of 0.070%), Immigrants from Honduras (83.3%, a difference of 0.070%), and Dominican (83.2%, a difference of 0.080%).
| Demographics | Rating | Rank | In Labor Force | Age 25-29 |
| Basques | 0.0 /100 | #270 | Tragic 83.4% |
| Hondurans | 0.0 /100 | #271 | Tragic 83.4% |
| Immigrants | Caribbean | 0.0 /100 | #272 | Tragic 83.4% |
| Immigrants | Dominica | 0.0 /100 | #273 | Tragic 83.4% |
| Marshallese | 0.0 /100 | #274 | Tragic 83.3% |
| Samoans | 0.0 /100 | #275 | Tragic 83.3% |
| Immigrants | Honduras | 0.0 /100 | #276 | Tragic 83.3% |
| Africans | 0.0 /100 | #277 | Tragic 83.2% |
| Immigrants | Cuba | 0.0 /100 | #278 | Tragic 83.2% |
| British West Indians | 0.0 /100 | #279 | Tragic 83.2% |
| Dominicans | 0.0 /100 | #280 | Tragic 83.2% |
| Immigrants | Dominican Republic | 0.0 /100 | #281 | Tragic 83.1% |
| Americans | 0.0 /100 | #282 | Tragic 83.1% |
| Immigrants | Azores | 0.0 /100 | #283 | Tragic 83.1% |
| Nicaraguans | 0.0 /100 | #284 | Tragic 83.1% |