Immigrants from Taiwan vs Lebanese In Labor Force | Age > 16
COMPARE
Immigrants from Taiwan
Lebanese
In Labor Force | Age > 16
In Labor Force | Age > 16 Comparison
Immigrants from Taiwan
Lebanese
65.5%
IN LABOR FORCE | AGE > 16
90.8/ 100
METRIC RATING
139th/ 347
METRIC RANK
64.5%
IN LABOR FORCE | AGE > 16
3.9/ 100
METRIC RATING
238th/ 347
METRIC RANK
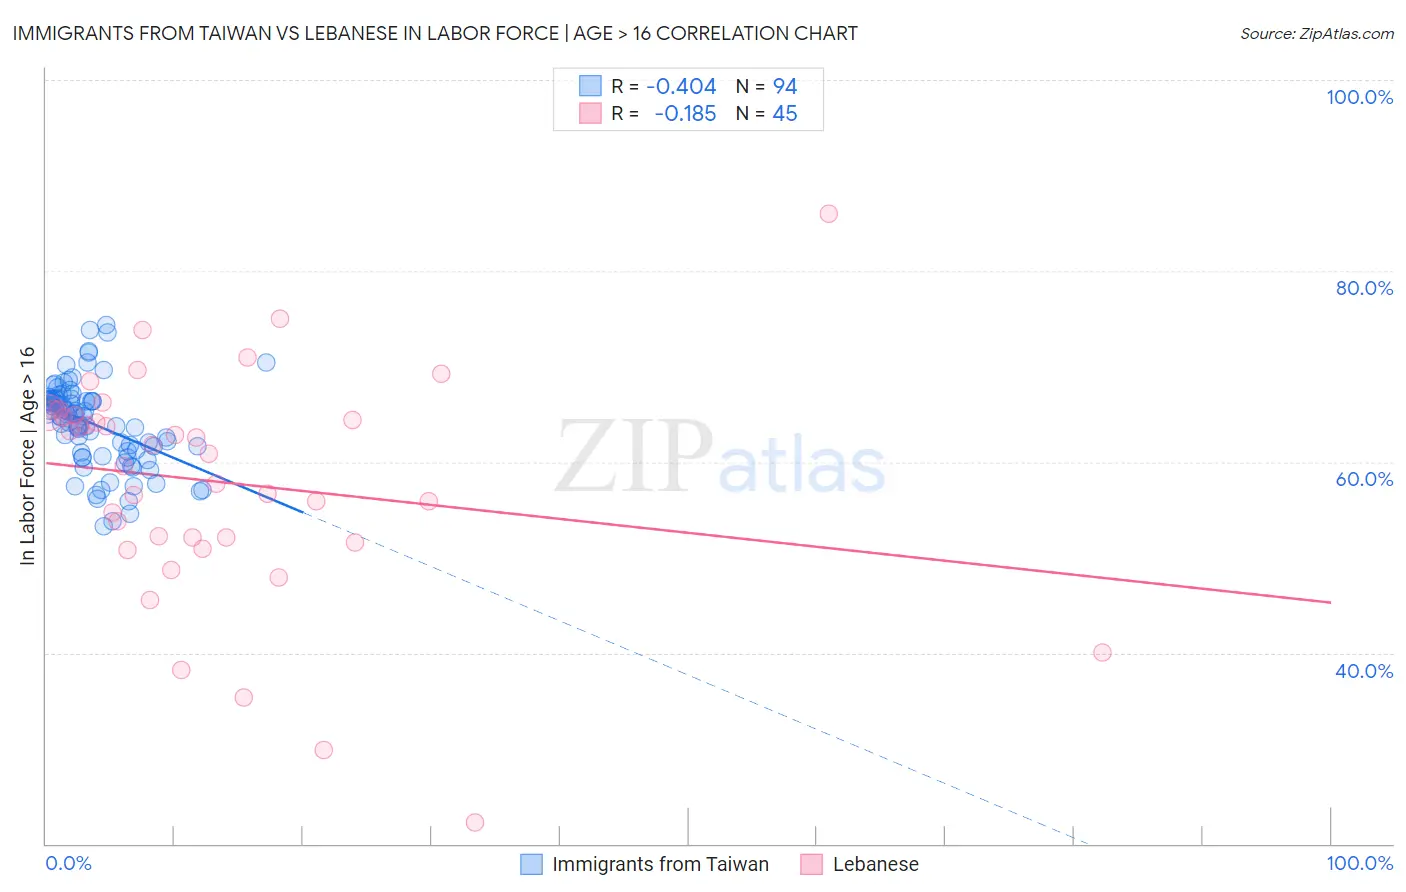
Immigrants from Taiwan vs Lebanese In Labor Force | Age > 16 Correlation Chart
The statistical analysis conducted on geographies consisting of 298,260,285 people shows a moderate negative correlation between the proportion of Immigrants from Taiwan and labor force participation rate among population ages 16 and over in the United States with a correlation coefficient (R) of -0.404 and weighted average of 65.5%. Similarly, the statistical analysis conducted on geographies consisting of 401,629,363 people shows a poor negative correlation between the proportion of Lebanese and labor force participation rate among population ages 16 and over in the United States with a correlation coefficient (R) of -0.185 and weighted average of 64.5%, a difference of 1.5%.
In Labor Force | Age > 16 Correlation Summary
| Measurement | Immigrants from Taiwan | Lebanese |
| Minimum | 53.2% | 22.2% |
| Maximum | 74.4% | 86.0% |
| Range | 21.2% | 63.8% |
| Mean | 63.9% | 57.9% |
| Median | 64.8% | 60.9% |
| Interquartile 25% (IQ1) | 61.0% | 51.8% |
| Interquartile 75% (IQ3) | 66.6% | 65.0% |
| Interquartile Range (IQR) | 5.6% | 13.2% |
| Standard Deviation (Sample) | 4.5% | 12.1% |
| Standard Deviation (Population) | 4.4% | 11.9% |
Similar Demographics by In Labor Force | Age > 16
Demographics Similar to Immigrants from Taiwan by In Labor Force | Age > 16
In terms of in labor force | age > 16, the demographic groups most similar to Immigrants from Taiwan are Immigrants from Costa Rica (65.5%, a difference of 0.0%), Samoan (65.5%, a difference of 0.010%), Immigrants from West Indies (65.6%, a difference of 0.040%), Indian (Asian) (65.5%, a difference of 0.040%), and Latvian (65.5%, a difference of 0.040%).
| Demographics | Rating | Rank | In Labor Force | Age > 16 |
| Immigrants | North Macedonia | 94.1 /100 | #132 | Exceptional 65.6% |
| Immigrants | Lithuania | 93.5 /100 | #133 | Exceptional 65.6% |
| Costa Ricans | 93.2 /100 | #134 | Exceptional 65.6% |
| Guatemalans | 92.5 /100 | #135 | Exceptional 65.6% |
| Immigrants | Argentina | 92.4 /100 | #136 | Exceptional 65.6% |
| Guamanians/Chamorros | 92.4 /100 | #137 | Exceptional 65.6% |
| Immigrants | West Indies | 92.0 /100 | #138 | Exceptional 65.6% |
| Immigrants | Taiwan | 90.8 /100 | #139 | Exceptional 65.5% |
| Immigrants | Costa Rica | 90.8 /100 | #140 | Exceptional 65.5% |
| Samoans | 90.5 /100 | #141 | Exceptional 65.5% |
| Indians (Asian) | 89.5 /100 | #142 | Excellent 65.5% |
| Latvians | 89.4 /100 | #143 | Excellent 65.5% |
| Immigrants | Romania | 88.6 /100 | #144 | Excellent 65.5% |
| Tlingit-Haida | 88.3 /100 | #145 | Excellent 65.5% |
| Cypriots | 88.2 /100 | #146 | Excellent 65.5% |
Demographics Similar to Lebanese by In Labor Force | Age > 16
In terms of in labor force | age > 16, the demographic groups most similar to Lebanese are Immigrants from Hungary (64.5%, a difference of 0.010%), Immigrants from Bangladesh (64.5%, a difference of 0.030%), Immigrants from Dominica (64.5%, a difference of 0.030%), Immigrants from Netherlands (64.5%, a difference of 0.040%), and Vietnamese (64.6%, a difference of 0.050%).
| Demographics | Rating | Rank | In Labor Force | Age > 16 |
| Immigrants | Northern Europe | 7.2 /100 | #231 | Tragic 64.7% |
| Africans | 5.8 /100 | #232 | Tragic 64.6% |
| Slavs | 4.9 /100 | #233 | Tragic 64.6% |
| Vietnamese | 4.7 /100 | #234 | Tragic 64.6% |
| Austrians | 4.6 /100 | #235 | Tragic 64.6% |
| Immigrants | Norway | 4.6 /100 | #236 | Tragic 64.6% |
| Italians | 4.6 /100 | #237 | Tragic 64.6% |
| Lebanese | 3.9 /100 | #238 | Tragic 64.5% |
| Immigrants | Hungary | 3.8 /100 | #239 | Tragic 64.5% |
| Immigrants | Bangladesh | 3.6 /100 | #240 | Tragic 64.5% |
| Immigrants | Dominica | 3.5 /100 | #241 | Tragic 64.5% |
| Immigrants | Netherlands | 3.4 /100 | #242 | Tragic 64.5% |
| Immigrants | Lebanon | 3.2 /100 | #243 | Tragic 64.5% |
| Tsimshian | 3.1 /100 | #244 | Tragic 64.5% |
| West Indians | 3.0 /100 | #245 | Tragic 64.5% |