Immigrants from Syria vs Alaskan Athabascan Single Female Poverty
COMPARE
Immigrants from Syria
Alaskan Athabascan
Single Female Poverty
Single Female Poverty Comparison
Immigrants from Syria
Alaskan Athabascans
19.9%
SINGLE FEMALE POVERTY
96.7/ 100
METRIC RATING
107th/ 347
METRIC RANK
23.6%
SINGLE FEMALE POVERTY
0.0/ 100
METRIC RATING
279th/ 347
METRIC RANK
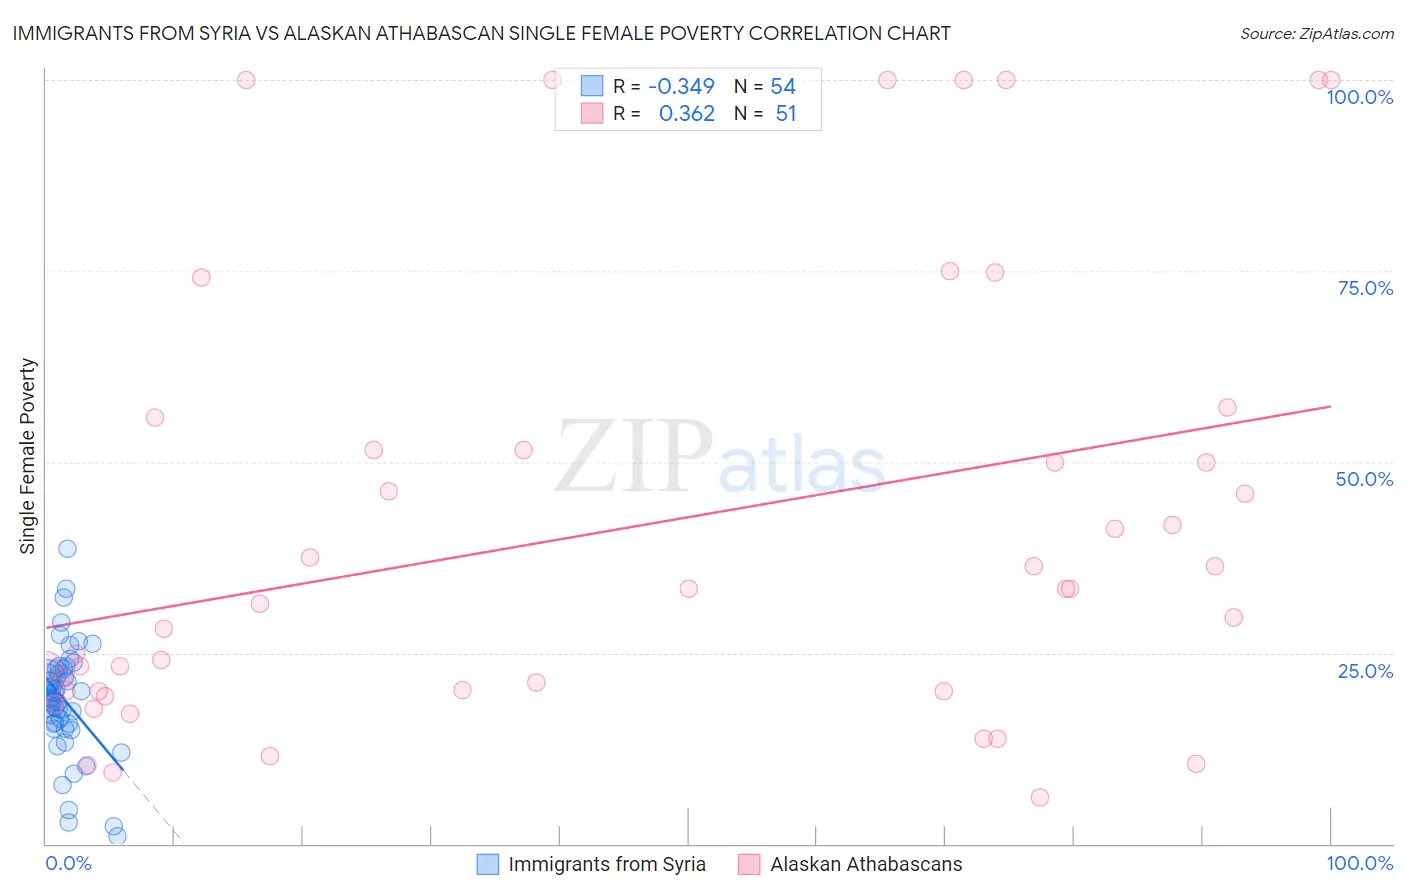
Immigrants from Syria vs Alaskan Athabascan Single Female Poverty Correlation Chart
The statistical analysis conducted on geographies consisting of 173,058,161 people shows a mild negative correlation between the proportion of Immigrants from Syria and poverty level among single females in the United States with a correlation coefficient (R) of -0.349 and weighted average of 19.9%. Similarly, the statistical analysis conducted on geographies consisting of 45,584,348 people shows a mild positive correlation between the proportion of Alaskan Athabascans and poverty level among single females in the United States with a correlation coefficient (R) of 0.362 and weighted average of 23.6%, a difference of 18.5%.
Single Female Poverty Correlation Summary
| Measurement | Immigrants from Syria | Alaskan Athabascan |
| Minimum | 0.97% | 6.0% |
| Maximum | 38.6% | 100.0% |
| Range | 37.6% | 94.0% |
| Mean | 18.8% | 41.2% |
| Median | 19.0% | 33.3% |
| Interquartile 25% (IQ1) | 15.8% | 20.0% |
| Interquartile 75% (IQ3) | 22.9% | 51.6% |
| Interquartile Range (IQR) | 7.1% | 31.6% |
| Standard Deviation (Sample) | 7.4% | 28.9% |
| Standard Deviation (Population) | 7.3% | 28.7% |
Similar Demographics by Single Female Poverty
Demographics Similar to Immigrants from Syria by Single Female Poverty
In terms of single female poverty, the demographic groups most similar to Immigrants from Syria are Ethiopian (19.9%, a difference of 0.020%), Native Hawaiian (19.9%, a difference of 0.050%), Colombian (19.9%, a difference of 0.060%), Immigrants from Western Asia (19.9%, a difference of 0.070%), and Israeli (19.9%, a difference of 0.11%).
| Demographics | Rating | Rank | Single Female Poverty |
| Ukrainians | 97.6 /100 | #100 | Exceptional 19.8% |
| Immigrants | Belgium | 97.3 /100 | #101 | Exceptional 19.8% |
| Immigrants | Cameroon | 97.3 /100 | #102 | Exceptional 19.8% |
| Immigrants | Southern Europe | 97.1 /100 | #103 | Exceptional 19.9% |
| Chileans | 96.9 /100 | #104 | Exceptional 19.9% |
| Israelis | 96.9 /100 | #105 | Exceptional 19.9% |
| Ethiopians | 96.7 /100 | #106 | Exceptional 19.9% |
| Immigrants | Syria | 96.7 /100 | #107 | Exceptional 19.9% |
| Native Hawaiians | 96.6 /100 | #108 | Exceptional 19.9% |
| Colombians | 96.6 /100 | #109 | Exceptional 19.9% |
| Immigrants | Western Asia | 96.5 /100 | #110 | Exceptional 19.9% |
| Carpatho Rusyns | 96.1 /100 | #111 | Exceptional 20.0% |
| Immigrants | Netherlands | 96.0 /100 | #112 | Exceptional 20.0% |
| Immigrants | Zimbabwe | 95.9 /100 | #113 | Exceptional 20.0% |
| Immigrants | Colombia | 95.9 /100 | #114 | Exceptional 20.0% |
Demographics Similar to Alaskan Athabascans by Single Female Poverty
In terms of single female poverty, the demographic groups most similar to Alaskan Athabascans are Nonimmigrants (23.6%, a difference of 0.040%), Pennsylvania German (23.6%, a difference of 0.11%), Immigrants from the Azores (23.5%, a difference of 0.27%), Immigrants from Latin America (23.7%, a difference of 0.49%), and Immigrants from Zaire (23.8%, a difference of 1.0%).
| Demographics | Rating | Rank | Single Female Poverty |
| Immigrants | Senegal | 0.1 /100 | #272 | Tragic 23.2% |
| Alaska Natives | 0.1 /100 | #273 | Tragic 23.3% |
| Marshallese | 0.1 /100 | #274 | Tragic 23.3% |
| Mexican American Indians | 0.1 /100 | #275 | Tragic 23.4% |
| Immigrants | Azores | 0.0 /100 | #276 | Tragic 23.5% |
| Pennsylvania Germans | 0.0 /100 | #277 | Tragic 23.6% |
| Immigrants | Nonimmigrants | 0.0 /100 | #278 | Tragic 23.6% |
| Alaskan Athabascans | 0.0 /100 | #279 | Tragic 23.6% |
| Immigrants | Latin America | 0.0 /100 | #280 | Tragic 23.7% |
| Immigrants | Zaire | 0.0 /100 | #281 | Tragic 23.8% |
| Guatemalans | 0.0 /100 | #282 | Tragic 23.8% |
| German Russians | 0.0 /100 | #283 | Tragic 23.9% |
| Immigrants | Dominica | 0.0 /100 | #284 | Tragic 23.9% |
| Immigrants | Guatemala | 0.0 /100 | #285 | Tragic 24.1% |
| Cree | 0.0 /100 | #286 | Tragic 24.1% |