Immigrants from Sudan vs Immigrants from Ghana Receiving Food Stamps
COMPARE
Immigrants from Sudan
Immigrants from Ghana
Receiving Food Stamps
Receiving Food Stamps Comparison
Immigrants from Sudan
Immigrants from Ghana
12.1%
RECEIVING FOOD STAMPS
27.1/ 100
METRIC RATING
194th/ 347
METRIC RANK
14.1%
RECEIVING FOOD STAMPS
0.3/ 100
METRIC RATING
258th/ 347
METRIC RANK
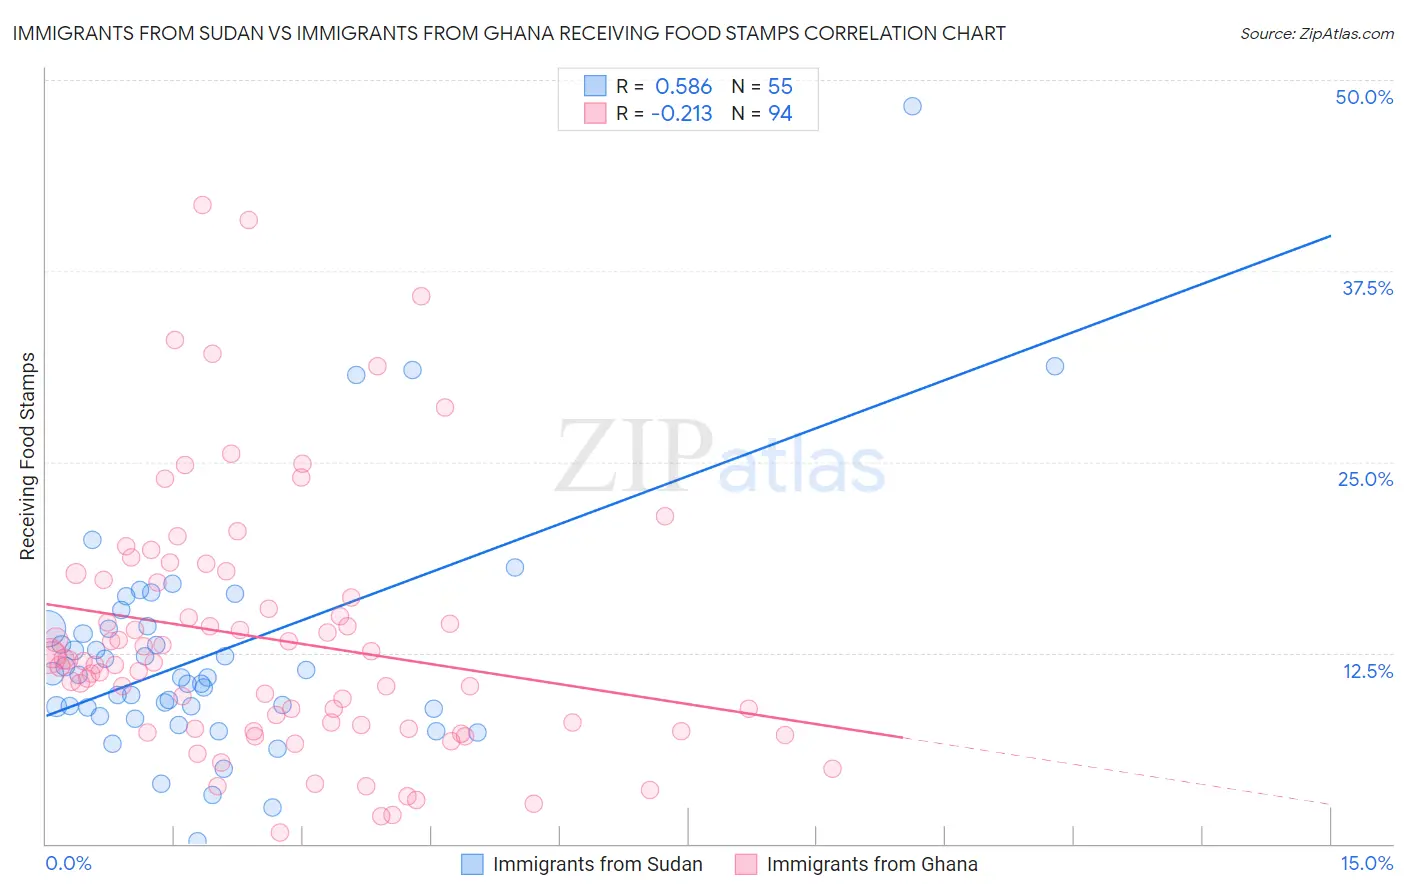
Immigrants from Sudan vs Immigrants from Ghana Receiving Food Stamps Correlation Chart
The statistical analysis conducted on geographies consisting of 118,933,467 people shows a substantial positive correlation between the proportion of Immigrants from Sudan and percentage of population receiving government assistance and/or food stamps in the United States with a correlation coefficient (R) of 0.586 and weighted average of 12.1%. Similarly, the statistical analysis conducted on geographies consisting of 199,399,375 people shows a weak negative correlation between the proportion of Immigrants from Ghana and percentage of population receiving government assistance and/or food stamps in the United States with a correlation coefficient (R) of -0.213 and weighted average of 14.1%, a difference of 16.2%.
Receiving Food Stamps Correlation Summary
| Measurement | Immigrants from Sudan | Immigrants from Ghana |
| Minimum | 0.20% | 0.70% |
| Maximum | 48.3% | 41.8% |
| Range | 48.1% | 41.1% |
| Mean | 12.5% | 13.4% |
| Median | 10.9% | 11.9% |
| Interquartile 25% (IQ1) | 8.8% | 7.5% |
| Interquartile 75% (IQ3) | 14.1% | 17.1% |
| Interquartile Range (IQR) | 5.3% | 9.6% |
| Standard Deviation (Sample) | 7.8% | 8.3% |
| Standard Deviation (Population) | 7.8% | 8.3% |
Similar Demographics by Receiving Food Stamps
Demographics Similar to Immigrants from Sudan by Receiving Food Stamps
In terms of receiving food stamps, the demographic groups most similar to Immigrants from Sudan are American (12.2%, a difference of 0.060%), Iraqi (12.2%, a difference of 0.090%), Immigrants from Fiji (12.1%, a difference of 0.12%), Delaware (12.2%, a difference of 0.17%), and Immigrants from Costa Rica (12.2%, a difference of 0.30%).
| Demographics | Rating | Rank | Receiving Food Stamps |
| Albanians | 35.4 /100 | #187 | Fair 12.0% |
| Sudanese | 33.4 /100 | #188 | Fair 12.0% |
| Immigrants | Cameroon | 32.5 /100 | #189 | Fair 12.0% |
| Immigrants | Peru | 32.2 /100 | #190 | Fair 12.0% |
| Venezuelans | 32.1 /100 | #191 | Fair 12.0% |
| Samoans | 31.0 /100 | #192 | Fair 12.1% |
| Immigrants | Fiji | 27.8 /100 | #193 | Fair 12.1% |
| Immigrants | Sudan | 27.1 /100 | #194 | Fair 12.1% |
| Americans | 26.7 /100 | #195 | Fair 12.2% |
| Iraqis | 26.6 /100 | #196 | Fair 12.2% |
| Delaware | 26.1 /100 | #197 | Fair 12.2% |
| Immigrants | Costa Rica | 25.4 /100 | #198 | Fair 12.2% |
| Portuguese | 25.1 /100 | #199 | Fair 12.2% |
| Sierra Leoneans | 23.6 /100 | #200 | Fair 12.2% |
| Ugandans | 22.5 /100 | #201 | Fair 12.2% |
Demographics Similar to Immigrants from Ghana by Receiving Food Stamps
In terms of receiving food stamps, the demographic groups most similar to Immigrants from Ghana are Arapaho (14.1%, a difference of 0.080%), Creek (14.1%, a difference of 0.12%), Japanese (14.1%, a difference of 0.18%), Subsaharan African (14.1%, a difference of 0.20%), and Marshallese (14.1%, a difference of 0.21%).
| Demographics | Rating | Rank | Receiving Food Stamps |
| Yaqui | 0.5 /100 | #251 | Tragic 13.9% |
| Ghanaians | 0.5 /100 | #252 | Tragic 14.0% |
| Spanish Americans | 0.4 /100 | #253 | Tragic 14.0% |
| Marshallese | 0.3 /100 | #254 | Tragic 14.1% |
| Sub-Saharan Africans | 0.3 /100 | #255 | Tragic 14.1% |
| Japanese | 0.3 /100 | #256 | Tragic 14.1% |
| Arapaho | 0.3 /100 | #257 | Tragic 14.1% |
| Immigrants | Ghana | 0.3 /100 | #258 | Tragic 14.1% |
| Creek | 0.3 /100 | #259 | Tragic 14.1% |
| Central Americans | 0.3 /100 | #260 | Tragic 14.1% |
| Immigrants | Congo | 0.3 /100 | #261 | Tragic 14.1% |
| Paiute | 0.2 /100 | #262 | Tragic 14.3% |
| Immigrants | Portugal | 0.2 /100 | #263 | Tragic 14.3% |
| Immigrants | Uzbekistan | 0.2 /100 | #264 | Tragic 14.3% |
| Blackfeet | 0.2 /100 | #265 | Tragic 14.3% |