Immigrants from Sudan vs Yuman Disability Age 18 to 34
COMPARE
Immigrants from Sudan
Yuman
Disability Age 18 to 34
Disability Age 18 to 34 Comparison
Immigrants from Sudan
Yuman
6.7%
DISABILITY AGE 18 TO 34
24.9/ 100
METRIC RATING
194th/ 347
METRIC RANK
10.6%
DISABILITY AGE 18 TO 34
0.0/ 100
METRIC RATING
347th/ 347
METRIC RANK
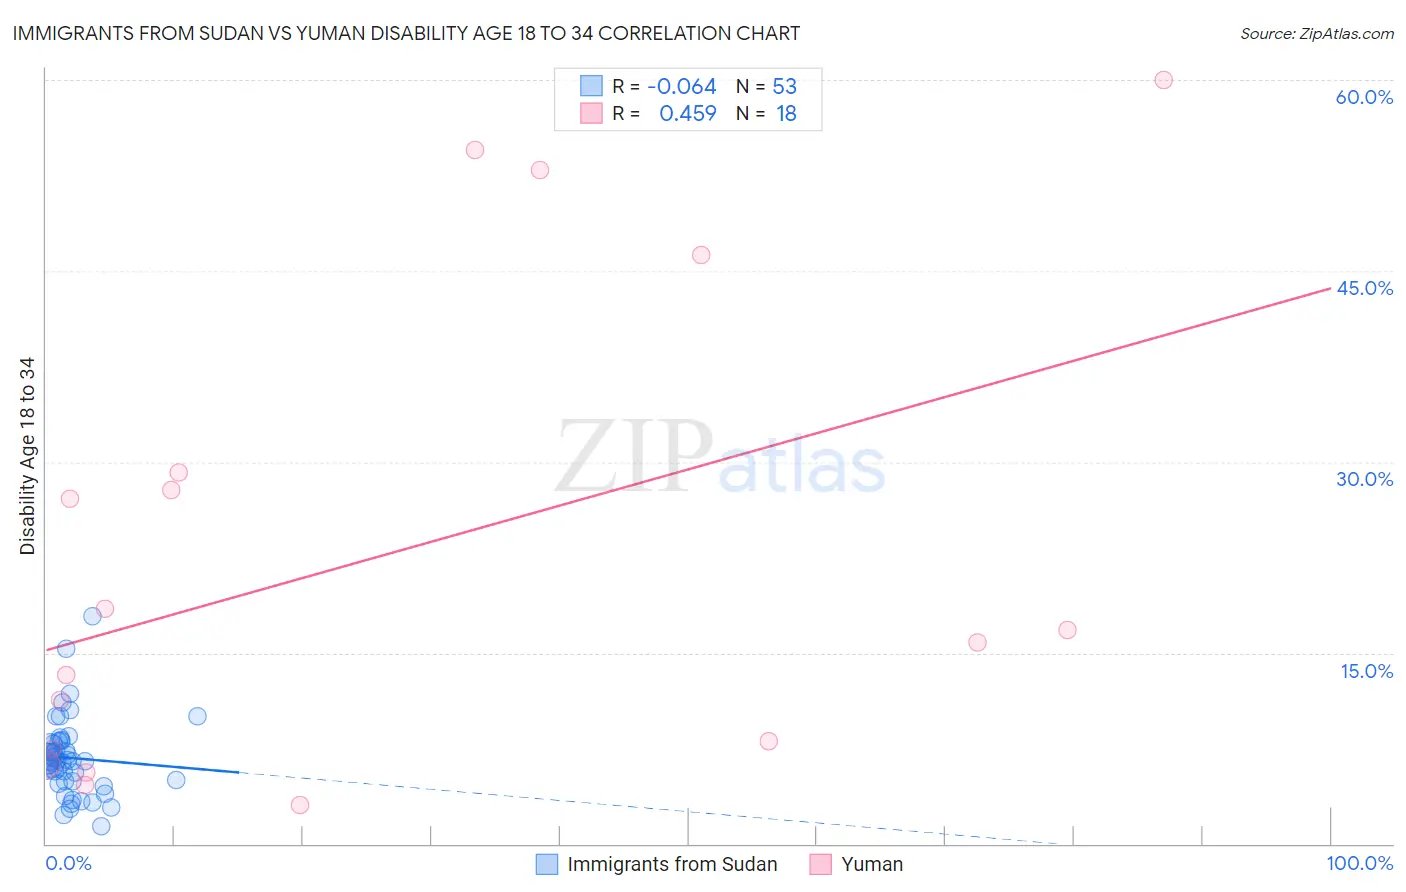
Immigrants from Sudan vs Yuman Disability Age 18 to 34 Correlation Chart
The statistical analysis conducted on geographies consisting of 118,941,653 people shows a slight negative correlation between the proportion of Immigrants from Sudan and percentage of population with a disability between the ages 18 and 35 in the United States with a correlation coefficient (R) of -0.064 and weighted average of 6.7%. Similarly, the statistical analysis conducted on geographies consisting of 40,657,868 people shows a moderate positive correlation between the proportion of Yuman and percentage of population with a disability between the ages 18 and 35 in the United States with a correlation coefficient (R) of 0.459 and weighted average of 10.6%, a difference of 57.0%.
Disability Age 18 to 34 Correlation Summary
| Measurement | Immigrants from Sudan | Yuman |
| Minimum | 1.4% | 3.0% |
| Maximum | 17.8% | 60.0% |
| Range | 16.5% | 57.0% |
| Mean | 6.7% | 22.7% |
| Median | 6.5% | 16.3% |
| Interquartile 25% (IQ1) | 4.9% | 7.4% |
| Interquartile 75% (IQ3) | 8.0% | 29.2% |
| Interquartile Range (IQR) | 3.1% | 21.8% |
| Standard Deviation (Sample) | 3.0% | 18.8% |
| Standard Deviation (Population) | 3.0% | 18.3% |
Similar Demographics by Disability Age 18 to 34
Demographics Similar to Immigrants from Sudan by Disability Age 18 to 34
In terms of disability age 18 to 34, the demographic groups most similar to Immigrants from Sudan are Immigrants from Uganda (6.7%, a difference of 0.020%), Mexican American Indian (6.7%, a difference of 0.25%), Immigrants from Western Africa (6.7%, a difference of 0.29%), Immigrants from Netherlands (6.7%, a difference of 0.38%), and Estonian (6.8%, a difference of 0.41%).
| Demographics | Rating | Rank | Disability Age 18 to 34 |
| Maltese | 34.8 /100 | #187 | Fair 6.7% |
| Immigrants | Cameroon | 34.5 /100 | #188 | Fair 6.7% |
| Pakistanis | 33.7 /100 | #189 | Fair 6.7% |
| Immigrants | Zimbabwe | 33.6 /100 | #190 | Fair 6.7% |
| Immigrants | Eastern Africa | 33.2 /100 | #191 | Fair 6.7% |
| Immigrants | Western Africa | 28.3 /100 | #192 | Fair 6.7% |
| Immigrants | Uganda | 25.1 /100 | #193 | Fair 6.7% |
| Immigrants | Sudan | 24.9 /100 | #194 | Fair 6.7% |
| Mexican American Indians | 22.3 /100 | #195 | Fair 6.7% |
| Immigrants | Netherlands | 21.0 /100 | #196 | Fair 6.7% |
| Estonians | 20.6 /100 | #197 | Fair 6.8% |
| Australians | 19.4 /100 | #198 | Poor 6.8% |
| Kenyans | 18.3 /100 | #199 | Poor 6.8% |
| Sierra Leoneans | 17.5 /100 | #200 | Poor 6.8% |
| Greeks | 16.1 /100 | #201 | Poor 6.8% |
Demographics Similar to Yuman by Disability Age 18 to 34
In terms of disability age 18 to 34, the demographic groups most similar to Yuman are Houma (9.7%, a difference of 8.9%), Alaskan Athabascan (9.4%, a difference of 11.8%), Creek (9.0%, a difference of 17.1%), Chippewa (9.0%, a difference of 17.6%), and Yakama (9.0%, a difference of 17.6%).
| Demographics | Rating | Rank | Disability Age 18 to 34 |
| Apache | 0.0 /100 | #333 | Tragic 8.4% |
| Dutch West Indians | 0.0 /100 | #334 | Tragic 8.4% |
| Seminole | 0.0 /100 | #335 | Tragic 8.4% |
| Immigrants | Azores | 0.0 /100 | #336 | Tragic 8.5% |
| Ottawa | 0.0 /100 | #337 | Tragic 8.6% |
| Cherokee | 0.0 /100 | #338 | Tragic 8.7% |
| Kiowa | 0.0 /100 | #339 | Tragic 8.8% |
| Choctaw | 0.0 /100 | #340 | Tragic 9.0% |
| Chickasaw | 0.0 /100 | #341 | Tragic 9.0% |
| Yakama | 0.0 /100 | #342 | Tragic 9.0% |
| Chippewa | 0.0 /100 | #343 | Tragic 9.0% |
| Creek | 0.0 /100 | #344 | Tragic 9.0% |
| Alaskan Athabascans | 0.0 /100 | #345 | Tragic 9.4% |
| Houma | 0.0 /100 | #346 | Tragic 9.7% |
| Yuman | 0.0 /100 | #347 | Tragic 10.6% |