Immigrants from Sudan vs Osage Receiving Food Stamps
COMPARE
Immigrants from Sudan
Osage
Receiving Food Stamps
Receiving Food Stamps Comparison
Immigrants from Sudan
Osage
12.1%
RECEIVING FOOD STAMPS
27.1/ 100
METRIC RATING
194th/ 347
METRIC RANK
11.7%
RECEIVING FOOD STAMPS
49.8/ 100
METRIC RATING
175th/ 347
METRIC RANK
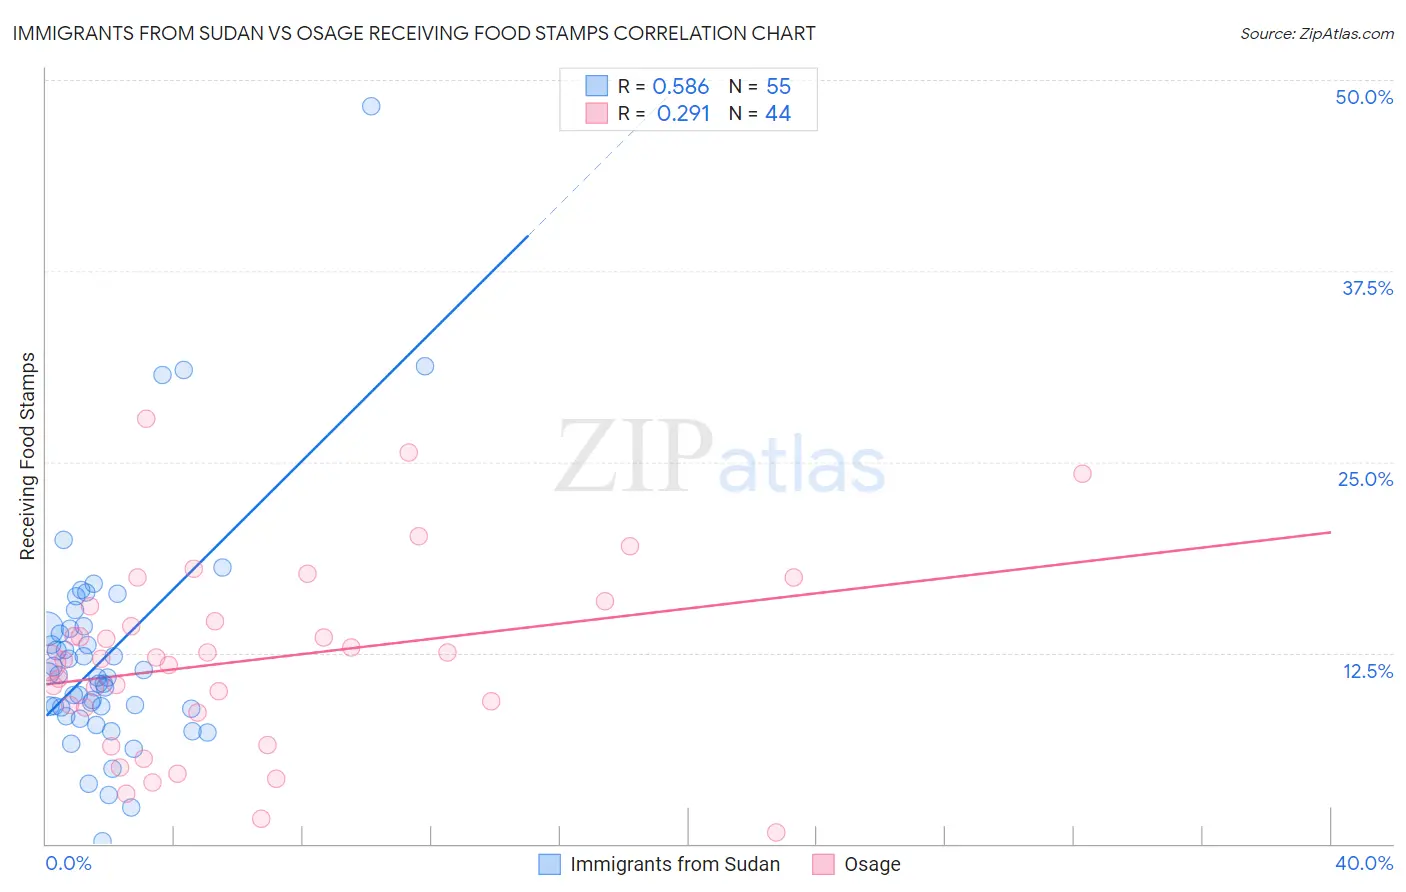
Immigrants from Sudan vs Osage Receiving Food Stamps Correlation Chart
The statistical analysis conducted on geographies consisting of 118,933,467 people shows a substantial positive correlation between the proportion of Immigrants from Sudan and percentage of population receiving government assistance and/or food stamps in the United States with a correlation coefficient (R) of 0.586 and weighted average of 12.1%. Similarly, the statistical analysis conducted on geographies consisting of 91,766,497 people shows a weak positive correlation between the proportion of Osage and percentage of population receiving government assistance and/or food stamps in the United States with a correlation coefficient (R) of 0.291 and weighted average of 11.7%, a difference of 3.4%.
Receiving Food Stamps Correlation Summary
| Measurement | Immigrants from Sudan | Osage |
| Minimum | 0.20% | 0.70% |
| Maximum | 48.3% | 27.8% |
| Range | 48.1% | 27.1% |
| Mean | 12.5% | 12.0% |
| Median | 10.9% | 12.1% |
| Interquartile 25% (IQ1) | 8.8% | 8.7% |
| Interquartile 75% (IQ3) | 14.1% | 15.0% |
| Interquartile Range (IQR) | 5.3% | 6.3% |
| Standard Deviation (Sample) | 7.8% | 6.1% |
| Standard Deviation (Population) | 7.8% | 6.0% |
Demographics Similar to Immigrants from Sudan and Osage by Receiving Food Stamps
In terms of receiving food stamps, the demographic groups most similar to Immigrants from Sudan are Immigrants from Fiji (12.1%, a difference of 0.12%), Samoan (12.1%, a difference of 0.64%), Venezuelan (12.0%, a difference of 0.82%), Immigrants from Peru (12.0%, a difference of 0.83%), and Immigrants from Cameroon (12.0%, a difference of 0.89%). Similarly, the demographic groups most similar to Osage are Immigrants from Eritrea (11.7%, a difference of 0.020%), Peruvian (11.7%, a difference of 0.070%), Immigrants from Ukraine (11.8%, a difference of 0.21%), German Russian (11.8%, a difference of 0.24%), and Immigrants from Kenya (11.8%, a difference of 0.48%).
| Demographics | Rating | Rank | Receiving Food Stamps |
| Immigrants | Eritrea | 50.0 /100 | #174 | Average 11.7% |
| Osage | 49.8 /100 | #175 | Average 11.7% |
| Peruvians | 49.3 /100 | #176 | Average 11.7% |
| Immigrants | Ukraine | 48.4 /100 | #177 | Average 11.8% |
| German Russians | 48.1 /100 | #178 | Average 11.8% |
| Immigrants | Kenya | 46.4 /100 | #179 | Average 11.8% |
| Uruguayans | 44.8 /100 | #180 | Average 11.8% |
| South American Indians | 41.7 /100 | #181 | Average 11.9% |
| Immigrants | Morocco | 40.7 /100 | #182 | Average 11.9% |
| Immigrants | Uganda | 40.3 /100 | #183 | Average 11.9% |
| Spaniards | 39.8 /100 | #184 | Fair 11.9% |
| Immigrants | Iraq | 37.1 /100 | #185 | Fair 12.0% |
| Spanish | 36.9 /100 | #186 | Fair 12.0% |
| Albanians | 35.4 /100 | #187 | Fair 12.0% |
| Sudanese | 33.4 /100 | #188 | Fair 12.0% |
| Immigrants | Cameroon | 32.5 /100 | #189 | Fair 12.0% |
| Immigrants | Peru | 32.2 /100 | #190 | Fair 12.0% |
| Venezuelans | 32.1 /100 | #191 | Fair 12.0% |
| Samoans | 31.0 /100 | #192 | Fair 12.1% |
| Immigrants | Fiji | 27.8 /100 | #193 | Fair 12.1% |
| Immigrants | Sudan | 27.1 /100 | #194 | Fair 12.1% |