Immigrants from Sudan vs Immigrants from Thailand Family Poverty
COMPARE
Immigrants from Sudan
Immigrants from Thailand
Family Poverty
Family Poverty Comparison
Immigrants from Sudan
Immigrants from Thailand
10.1%
FAMILY POVERTY
2.3/ 100
METRIC RATING
232nd/ 347
METRIC RANK
9.7%
FAMILY POVERTY
9.7/ 100
METRIC RATING
212th/ 347
METRIC RANK
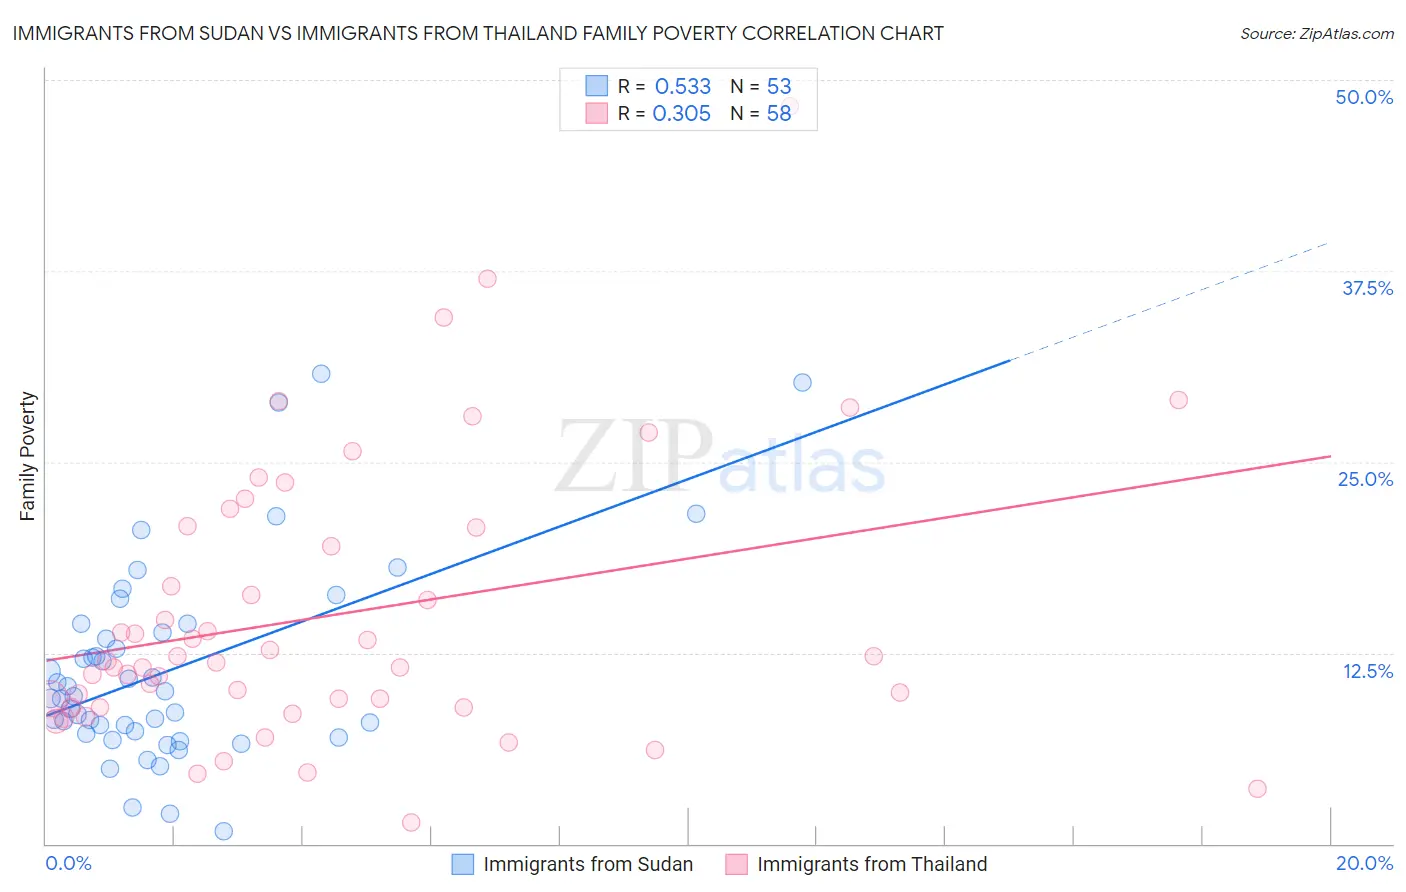
Immigrants from Sudan vs Immigrants from Thailand Family Poverty Correlation Chart
The statistical analysis conducted on geographies consisting of 118,923,711 people shows a substantial positive correlation between the proportion of Immigrants from Sudan and poverty level among families in the United States with a correlation coefficient (R) of 0.533 and weighted average of 10.1%. Similarly, the statistical analysis conducted on geographies consisting of 316,654,872 people shows a mild positive correlation between the proportion of Immigrants from Thailand and poverty level among families in the United States with a correlation coefficient (R) of 0.305 and weighted average of 9.7%, a difference of 4.6%.
Family Poverty Correlation Summary
| Measurement | Immigrants from Sudan | Immigrants from Thailand |
| Minimum | 0.80% | 1.4% |
| Maximum | 30.8% | 48.3% |
| Range | 30.0% | 46.9% |
| Mean | 11.4% | 15.0% |
| Median | 9.7% | 11.9% |
| Interquartile 25% (IQ1) | 7.3% | 8.9% |
| Interquartile 75% (IQ3) | 14.1% | 20.7% |
| Interquartile Range (IQR) | 6.9% | 11.8% |
| Standard Deviation (Sample) | 6.5% | 9.2% |
| Standard Deviation (Population) | 6.4% | 9.1% |
Demographics Similar to Immigrants from Sudan and Immigrants from Thailand by Family Poverty
In terms of family poverty, the demographic groups most similar to Immigrants from Sudan are Alaskan Athabascan (10.1%, a difference of 0.43%), Immigrants from Panama (10.0%, a difference of 0.82%), Immigrants from Uzbekistan (10.0%, a difference of 0.84%), Sudanese (10.0%, a difference of 0.85%), and Immigrants from Armenia (10.0%, a difference of 1.1%). Similarly, the demographic groups most similar to Immigrants from Thailand are Osage (9.7%, a difference of 0.63%), Immigrants from Micronesia (9.8%, a difference of 1.2%), Nonimmigrants (9.8%, a difference of 1.2%), Moroccan (9.8%, a difference of 1.3%), and American (9.8%, a difference of 1.5%).
| Demographics | Rating | Rank | Family Poverty |
| Immigrants | Thailand | 9.7 /100 | #212 | Tragic 9.7% |
| Osage | 8.0 /100 | #213 | Tragic 9.7% |
| Immigrants | Micronesia | 6.7 /100 | #214 | Tragic 9.8% |
| Immigrants | Nonimmigrants | 6.7 /100 | #215 | Tragic 9.8% |
| Moroccans | 6.5 /100 | #216 | Tragic 9.8% |
| Americans | 6.2 /100 | #217 | Tragic 9.8% |
| Panamanians | 5.6 /100 | #218 | Tragic 9.8% |
| Immigrants | Eritrea | 5.4 /100 | #219 | Tragic 9.9% |
| Bermudans | 5.3 /100 | #220 | Tragic 9.9% |
| Immigrants | Cambodia | 4.8 /100 | #221 | Tragic 9.9% |
| Japanese | 4.8 /100 | #222 | Tragic 9.9% |
| Immigrants | Africa | 4.3 /100 | #223 | Tragic 9.9% |
| Marshallese | 3.9 /100 | #224 | Tragic 9.9% |
| Immigrants | Immigrants | 3.6 /100 | #225 | Tragic 10.0% |
| Ottawa | 3.3 /100 | #226 | Tragic 10.0% |
| Immigrants | Armenia | 3.3 /100 | #227 | Tragic 10.0% |
| Sudanese | 3.1 /100 | #228 | Tragic 10.0% |
| Immigrants | Uzbekistan | 3.1 /100 | #229 | Tragic 10.0% |
| Immigrants | Panama | 3.1 /100 | #230 | Tragic 10.0% |
| Alaskan Athabascans | 2.7 /100 | #231 | Tragic 10.1% |
| Immigrants | Sudan | 2.3 /100 | #232 | Tragic 10.1% |