Central American Indian vs Carpatho Rusyn Female Poverty
COMPARE
Central American Indian
Carpatho Rusyn
Female Poverty
Female Poverty Comparison
Central American Indians
Carpatho Rusyns
18.0%
FEMALE POVERTY
0.0/ 100
METRIC RATING
326th/ 347
METRIC RANK
12.2%
FEMALE POVERTY
97.6/ 100
METRIC RATING
71st/ 347
METRIC RANK
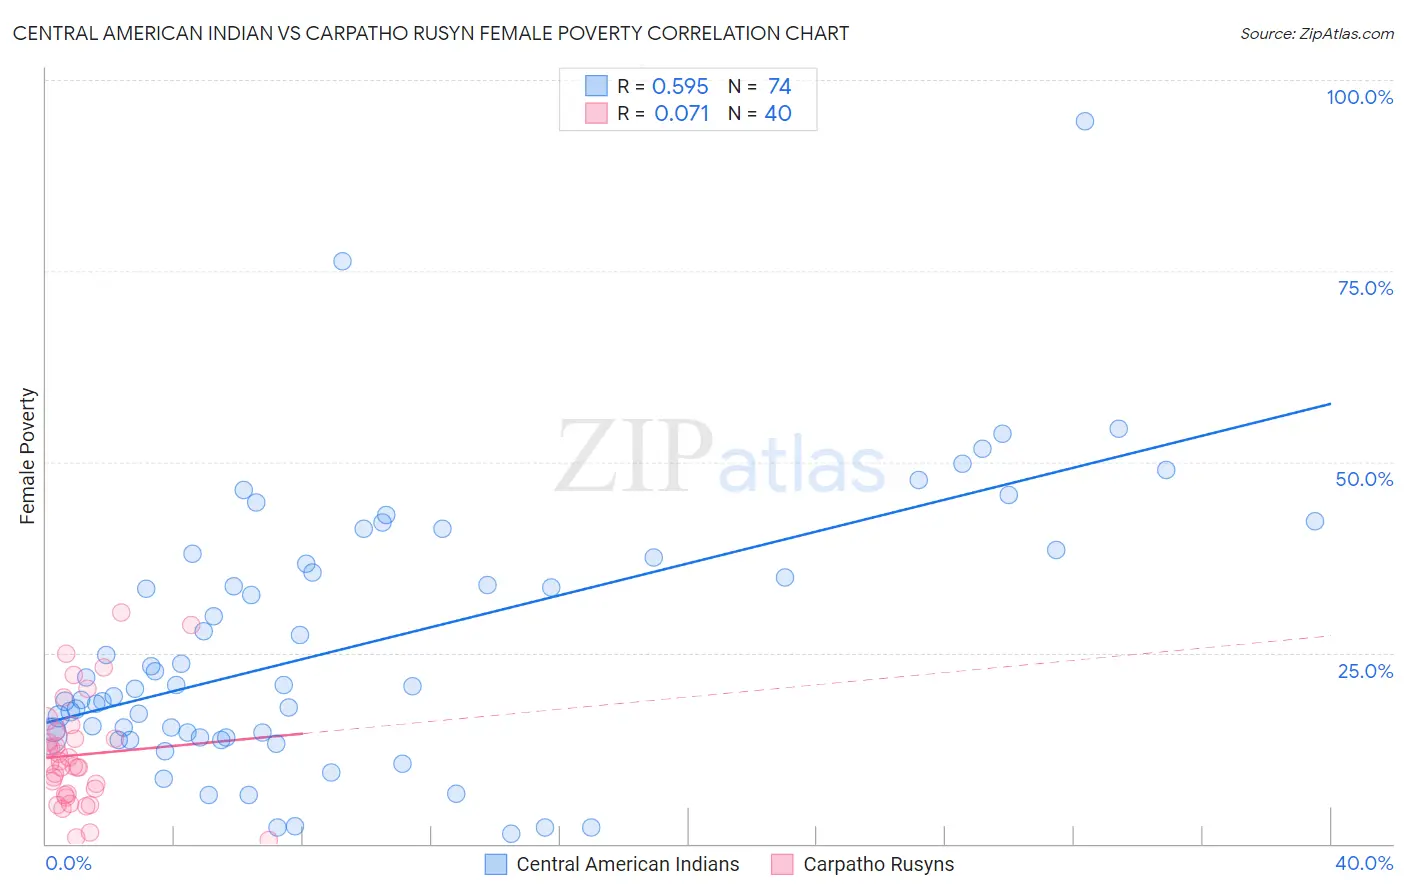
Central American Indian vs Carpatho Rusyn Female Poverty Correlation Chart
The statistical analysis conducted on geographies consisting of 326,040,737 people shows a substantial positive correlation between the proportion of Central American Indians and poverty level among females in the United States with a correlation coefficient (R) of 0.595 and weighted average of 18.0%. Similarly, the statistical analysis conducted on geographies consisting of 58,861,278 people shows a slight positive correlation between the proportion of Carpatho Rusyns and poverty level among females in the United States with a correlation coefficient (R) of 0.071 and weighted average of 12.2%, a difference of 47.2%.
Female Poverty Correlation Summary
| Measurement | Central American Indian | Carpatho Rusyn |
| Minimum | 1.4% | 0.50% |
| Maximum | 94.5% | 30.2% |
| Range | 93.2% | 29.7% |
| Mean | 26.1% | 11.6% |
| Median | 20.8% | 10.3% |
| Interquartile 25% (IQ1) | 14.1% | 6.5% |
| Interquartile 75% (IQ3) | 37.5% | 14.3% |
| Interquartile Range (IQR) | 23.4% | 7.8% |
| Standard Deviation (Sample) | 17.4% | 7.1% |
| Standard Deviation (Population) | 17.3% | 7.0% |
Similar Demographics by Female Poverty
Demographics Similar to Central American Indians by Female Poverty
In terms of female poverty, the demographic groups most similar to Central American Indians are Yakama (18.0%, a difference of 0.10%), Colville (17.8%, a difference of 1.5%), Immigrants from Honduras (17.7%, a difference of 1.7%), Paiute (17.7%, a difference of 1.9%), and Menominee (17.6%, a difference of 2.5%).
| Demographics | Rating | Rank | Female Poverty |
| Cajuns | 0.0 /100 | #319 | Tragic 17.5% |
| Immigrants | Dominica | 0.0 /100 | #320 | Tragic 17.5% |
| Arapaho | 0.0 /100 | #321 | Tragic 17.5% |
| Menominee | 0.0 /100 | #322 | Tragic 17.6% |
| Paiute | 0.0 /100 | #323 | Tragic 17.7% |
| Immigrants | Honduras | 0.0 /100 | #324 | Tragic 17.7% |
| Colville | 0.0 /100 | #325 | Tragic 17.8% |
| Central American Indians | 0.0 /100 | #326 | Tragic 18.0% |
| Yakama | 0.0 /100 | #327 | Tragic 18.0% |
| Blacks/African Americans | 0.0 /100 | #328 | Tragic 18.6% |
| Kiowa | 0.0 /100 | #329 | Tragic 18.6% |
| Dominicans | 0.0 /100 | #330 | Tragic 19.1% |
| Natives/Alaskans | 0.0 /100 | #331 | Tragic 19.2% |
| Apache | 0.0 /100 | #332 | Tragic 19.2% |
| Immigrants | Dominican Republic | 0.0 /100 | #333 | Tragic 19.3% |
Demographics Similar to Carpatho Rusyns by Female Poverty
In terms of female poverty, the demographic groups most similar to Carpatho Rusyns are Cambodian (12.2%, a difference of 0.030%), Zimbabwean (12.3%, a difference of 0.050%), Immigrants from Canada (12.3%, a difference of 0.060%), Immigrants from Belgium (12.2%, a difference of 0.13%), and Swiss (12.2%, a difference of 0.15%).
| Demographics | Rating | Rank | Female Poverty |
| Germans | 98.0 /100 | #64 | Exceptional 12.2% |
| Indians (Asian) | 97.9 /100 | #65 | Exceptional 12.2% |
| Austrians | 97.9 /100 | #66 | Exceptional 12.2% |
| Immigrants | Eastern Asia | 97.8 /100 | #67 | Exceptional 12.2% |
| Immigrants | Netherlands | 97.8 /100 | #68 | Exceptional 12.2% |
| Swiss | 97.7 /100 | #69 | Exceptional 12.2% |
| Immigrants | Belgium | 97.7 /100 | #70 | Exceptional 12.2% |
| Carpatho Rusyns | 97.6 /100 | #71 | Exceptional 12.2% |
| Cambodians | 97.5 /100 | #72 | Exceptional 12.2% |
| Zimbabweans | 97.5 /100 | #73 | Exceptional 12.3% |
| Immigrants | Canada | 97.5 /100 | #74 | Exceptional 12.3% |
| Europeans | 97.4 /100 | #75 | Exceptional 12.3% |
| Immigrants | Eastern Europe | 97.2 /100 | #76 | Exceptional 12.3% |
| Serbians | 97.2 /100 | #77 | Exceptional 12.3% |
| Egyptians | 97.2 /100 | #78 | Exceptional 12.3% |