Immigrants from St. Vincent and the Grenadines vs Brazilian Female Poverty
COMPARE
Immigrants from St. Vincent and the Grenadines
Brazilian
Female Poverty
Female Poverty Comparison
Immigrants from St. Vincent and the Grenadines
Brazilians
15.9%
FEMALE POVERTY
0.0/ 100
METRIC RATING
271st/ 347
METRIC RANK
13.0%
FEMALE POVERTY
80.5/ 100
METRIC RATING
142nd/ 347
METRIC RANK
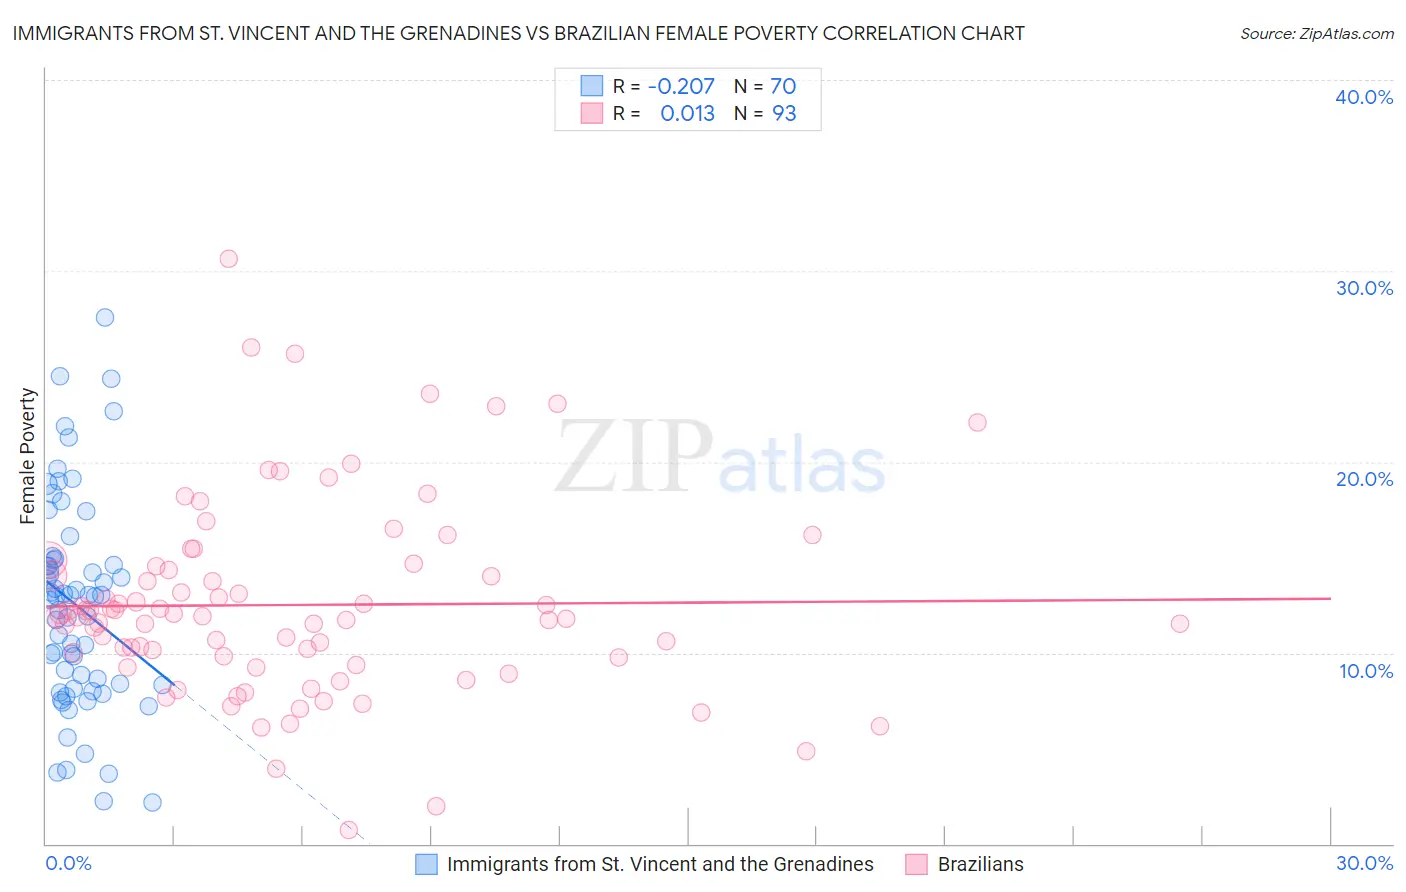
Immigrants from St. Vincent and the Grenadines vs Brazilian Female Poverty Correlation Chart
The statistical analysis conducted on geographies consisting of 56,090,975 people shows a weak negative correlation between the proportion of Immigrants from St. Vincent and the Grenadines and poverty level among females in the United States with a correlation coefficient (R) of -0.207 and weighted average of 15.9%. Similarly, the statistical analysis conducted on geographies consisting of 323,667,111 people shows no correlation between the proportion of Brazilians and poverty level among females in the United States with a correlation coefficient (R) of 0.013 and weighted average of 13.0%, a difference of 22.5%.
Female Poverty Correlation Summary
| Measurement | Immigrants from St. Vincent and the Grenadines | Brazilian |
| Minimum | 2.1% | 0.74% |
| Maximum | 27.6% | 30.6% |
| Range | 25.5% | 29.9% |
| Mean | 12.5% | 12.5% |
| Median | 13.0% | 11.9% |
| Interquartile 25% (IQ1) | 8.3% | 9.6% |
| Interquartile 75% (IQ3) | 14.8% | 14.4% |
| Interquartile Range (IQR) | 6.5% | 4.9% |
| Standard Deviation (Sample) | 5.4% | 5.1% |
| Standard Deviation (Population) | 5.4% | 5.1% |
Similar Demographics by Female Poverty
Demographics Similar to Immigrants from St. Vincent and the Grenadines by Female Poverty
In terms of female poverty, the demographic groups most similar to Immigrants from St. Vincent and the Grenadines are Belizean (15.9%, a difference of 0.23%), Haitian (15.9%, a difference of 0.23%), Barbadian (15.9%, a difference of 0.24%), Chickasaw (15.9%, a difference of 0.28%), and Immigrants from Barbados (16.0%, a difference of 0.30%).
| Demographics | Rating | Rank | Female Poverty |
| Immigrants | Ecuador | 0.1 /100 | #264 | Tragic 15.6% |
| Immigrants | Liberia | 0.1 /100 | #265 | Tragic 15.7% |
| Immigrants | El Salvador | 0.1 /100 | #266 | Tragic 15.7% |
| Sub-Saharan Africans | 0.1 /100 | #267 | Tragic 15.8% |
| Immigrants | Nicaragua | 0.1 /100 | #268 | Tragic 15.8% |
| Iroquois | 0.1 /100 | #269 | Tragic 15.8% |
| Chickasaw | 0.1 /100 | #270 | Tragic 15.9% |
| Immigrants | St. Vincent and the Grenadines | 0.0 /100 | #271 | Tragic 15.9% |
| Belizeans | 0.0 /100 | #272 | Tragic 15.9% |
| Haitians | 0.0 /100 | #273 | Tragic 15.9% |
| Barbadians | 0.0 /100 | #274 | Tragic 15.9% |
| Immigrants | Barbados | 0.0 /100 | #275 | Tragic 16.0% |
| Central Americans | 0.0 /100 | #276 | Tragic 16.0% |
| Bangladeshis | 0.0 /100 | #277 | Tragic 16.0% |
| Immigrants | West Indies | 0.0 /100 | #278 | Tragic 16.1% |
Demographics Similar to Brazilians by Female Poverty
In terms of female poverty, the demographic groups most similar to Brazilians are Immigrants from Malaysia (13.0%, a difference of 0.020%), Icelander (13.0%, a difference of 0.10%), Afghan (13.0%, a difference of 0.11%), Syrian (13.0%, a difference of 0.14%), and Immigrants from Peru (13.0%, a difference of 0.22%).
| Demographics | Rating | Rank | Female Poverty |
| French | 85.6 /100 | #135 | Excellent 12.9% |
| Peruvians | 85.2 /100 | #136 | Excellent 12.9% |
| Chileans | 84.7 /100 | #137 | Excellent 12.9% |
| Immigrants | France | 83.6 /100 | #138 | Excellent 12.9% |
| Basques | 83.1 /100 | #139 | Excellent 12.9% |
| Pakistanis | 83.0 /100 | #140 | Excellent 12.9% |
| Icelanders | 81.1 /100 | #141 | Excellent 13.0% |
| Brazilians | 80.5 /100 | #142 | Excellent 13.0% |
| Immigrants | Malaysia | 80.4 /100 | #143 | Excellent 13.0% |
| Afghans | 79.8 /100 | #144 | Good 13.0% |
| Syrians | 79.6 /100 | #145 | Good 13.0% |
| Immigrants | Peru | 79.1 /100 | #146 | Good 13.0% |
| Immigrants | Kazakhstan | 78.6 /100 | #147 | Good 13.0% |
| Yugoslavians | 76.9 /100 | #148 | Good 13.1% |
| Taiwanese | 75.7 /100 | #149 | Good 13.1% |