Immigrants from South Eastern Asia vs Houma Female Poverty
COMPARE
Immigrants from South Eastern Asia
Houma
Female Poverty
Female Poverty Comparison
Immigrants from South Eastern Asia
Houma
12.7%
FEMALE POVERTY
89.9/ 100
METRIC RATING
123rd/ 347
METRIC RANK
20.0%
FEMALE POVERTY
0.0/ 100
METRIC RATING
334th/ 347
METRIC RANK
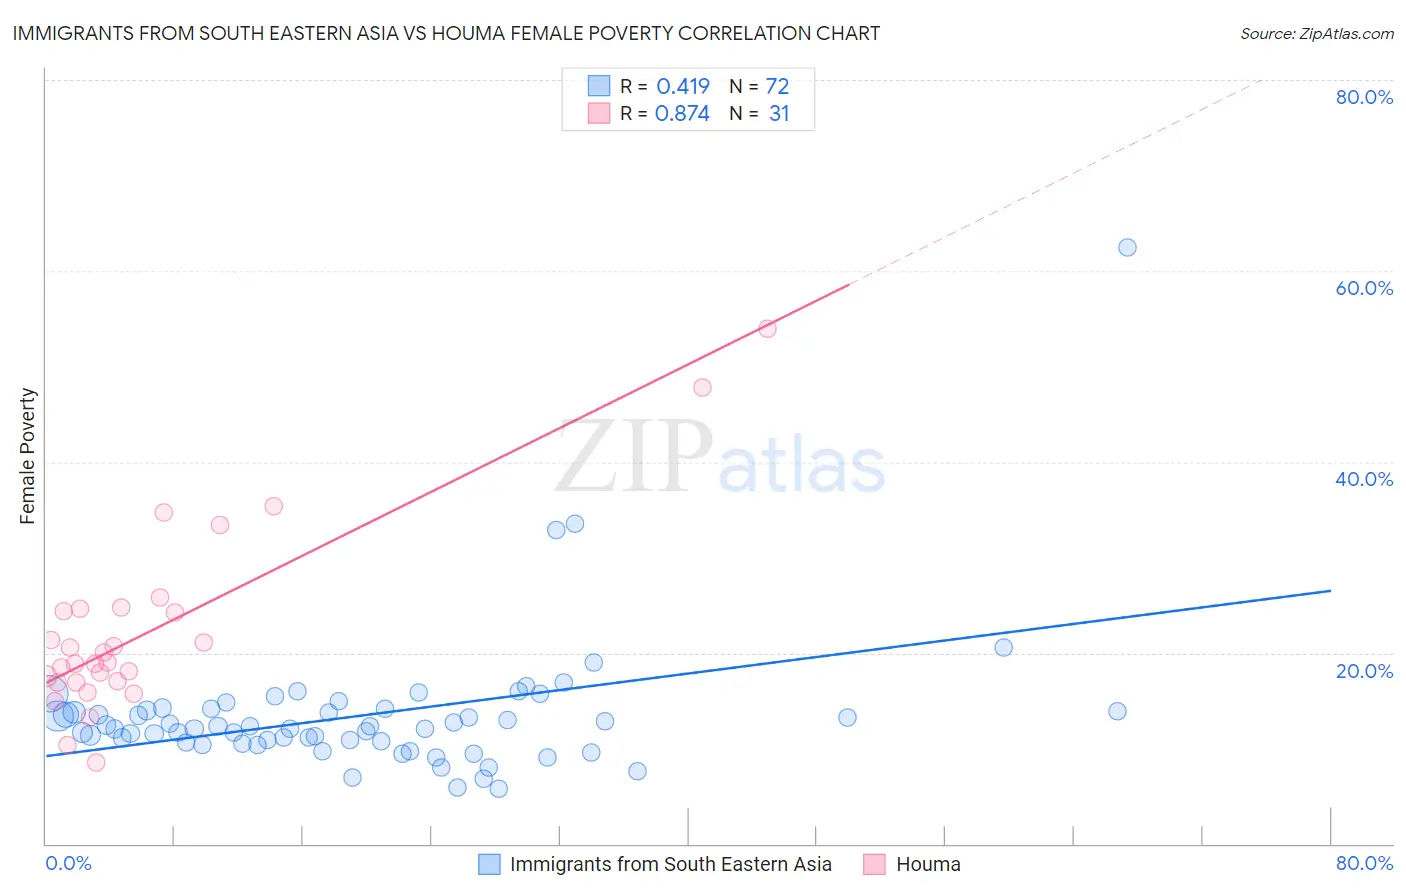
Immigrants from South Eastern Asia vs Houma Female Poverty Correlation Chart
The statistical analysis conducted on geographies consisting of 512,071,275 people shows a moderate positive correlation between the proportion of Immigrants from South Eastern Asia and poverty level among females in the United States with a correlation coefficient (R) of 0.419 and weighted average of 12.7%. Similarly, the statistical analysis conducted on geographies consisting of 36,796,778 people shows a very strong positive correlation between the proportion of Houma and poverty level among females in the United States with a correlation coefficient (R) of 0.874 and weighted average of 20.0%, a difference of 57.4%.
Female Poverty Correlation Summary
| Measurement | Immigrants from South Eastern Asia | Houma |
| Minimum | 5.8% | 8.5% |
| Maximum | 62.5% | 53.9% |
| Range | 56.7% | 45.4% |
| Mean | 13.4% | 22.3% |
| Median | 12.2% | 19.0% |
| Interquartile 25% (IQ1) | 10.6% | 16.9% |
| Interquartile 75% (IQ3) | 14.0% | 24.6% |
| Interquartile Range (IQR) | 3.4% | 7.7% |
| Standard Deviation (Sample) | 7.4% | 9.8% |
| Standard Deviation (Population) | 7.3% | 9.7% |
Similar Demographics by Female Poverty
Demographics Similar to Immigrants from South Eastern Asia by Female Poverty
In terms of female poverty, the demographic groups most similar to Immigrants from South Eastern Asia are French Canadian (12.7%, a difference of 0.070%), Immigrants from Hungary (12.7%, a difference of 0.10%), Immigrants from Norway (12.8%, a difference of 0.18%), New Zealander (12.7%, a difference of 0.21%), and Argentinean (12.8%, a difference of 0.23%).
| Demographics | Rating | Rank | Female Poverty |
| Immigrants | Russia | 91.2 /100 | #116 | Exceptional 12.7% |
| Immigrants | Southern Europe | 90.9 /100 | #117 | Exceptional 12.7% |
| Sri Lankans | 90.9 /100 | #118 | Exceptional 12.7% |
| Albanians | 90.8 /100 | #119 | Exceptional 12.7% |
| New Zealanders | 90.6 /100 | #120 | Exceptional 12.7% |
| Immigrants | Hungary | 90.3 /100 | #121 | Exceptional 12.7% |
| French Canadians | 90.2 /100 | #122 | Exceptional 12.7% |
| Immigrants | South Eastern Asia | 89.9 /100 | #123 | Excellent 12.7% |
| Immigrants | Norway | 89.3 /100 | #124 | Excellent 12.8% |
| Argentineans | 89.1 /100 | #125 | Excellent 12.8% |
| Immigrants | Ukraine | 88.8 /100 | #126 | Excellent 12.8% |
| South Africans | 88.4 /100 | #127 | Excellent 12.8% |
| Immigrants | Belarus | 88.2 /100 | #128 | Excellent 12.8% |
| Immigrants | Brazil | 87.9 /100 | #129 | Excellent 12.8% |
| Immigrants | Vietnam | 87.1 /100 | #130 | Excellent 12.8% |
Demographics Similar to Houma by Female Poverty
In terms of female poverty, the demographic groups most similar to Houma are Cheyenne (20.2%, a difference of 0.77%), Pueblo (20.7%, a difference of 3.2%), Immigrants from Dominican Republic (19.3%, a difference of 3.6%), Yuman (20.8%, a difference of 4.0%), and Apache (19.2%, a difference of 4.2%).
| Demographics | Rating | Rank | Female Poverty |
| Yakama | 0.0 /100 | #327 | Tragic 18.0% |
| Blacks/African Americans | 0.0 /100 | #328 | Tragic 18.6% |
| Kiowa | 0.0 /100 | #329 | Tragic 18.6% |
| Dominicans | 0.0 /100 | #330 | Tragic 19.1% |
| Natives/Alaskans | 0.0 /100 | #331 | Tragic 19.2% |
| Apache | 0.0 /100 | #332 | Tragic 19.2% |
| Immigrants | Dominican Republic | 0.0 /100 | #333 | Tragic 19.3% |
| Houma | 0.0 /100 | #334 | Tragic 20.0% |
| Cheyenne | 0.0 /100 | #335 | Tragic 20.2% |
| Pueblo | 0.0 /100 | #336 | Tragic 20.7% |
| Yuman | 0.0 /100 | #337 | Tragic 20.8% |
| Sioux | 0.0 /100 | #338 | Tragic 20.9% |
| Hopi | 0.0 /100 | #339 | Tragic 21.0% |
| Yup'ik | 0.0 /100 | #340 | Tragic 21.5% |
| Crow | 0.0 /100 | #341 | Tragic 22.1% |