Immigrants from South Africa vs Yuman Professional Degree
COMPARE
Immigrants from South Africa
Yuman
Professional Degree
Professional Degree Comparison
Immigrants from South Africa
Yuman
6.0%
PROFESSIONAL DEGREE
100.0/ 100
METRIC RATING
39th/ 347
METRIC RANK
3.3%
PROFESSIONAL DEGREE
0.1/ 100
METRIC RATING
313th/ 347
METRIC RANK
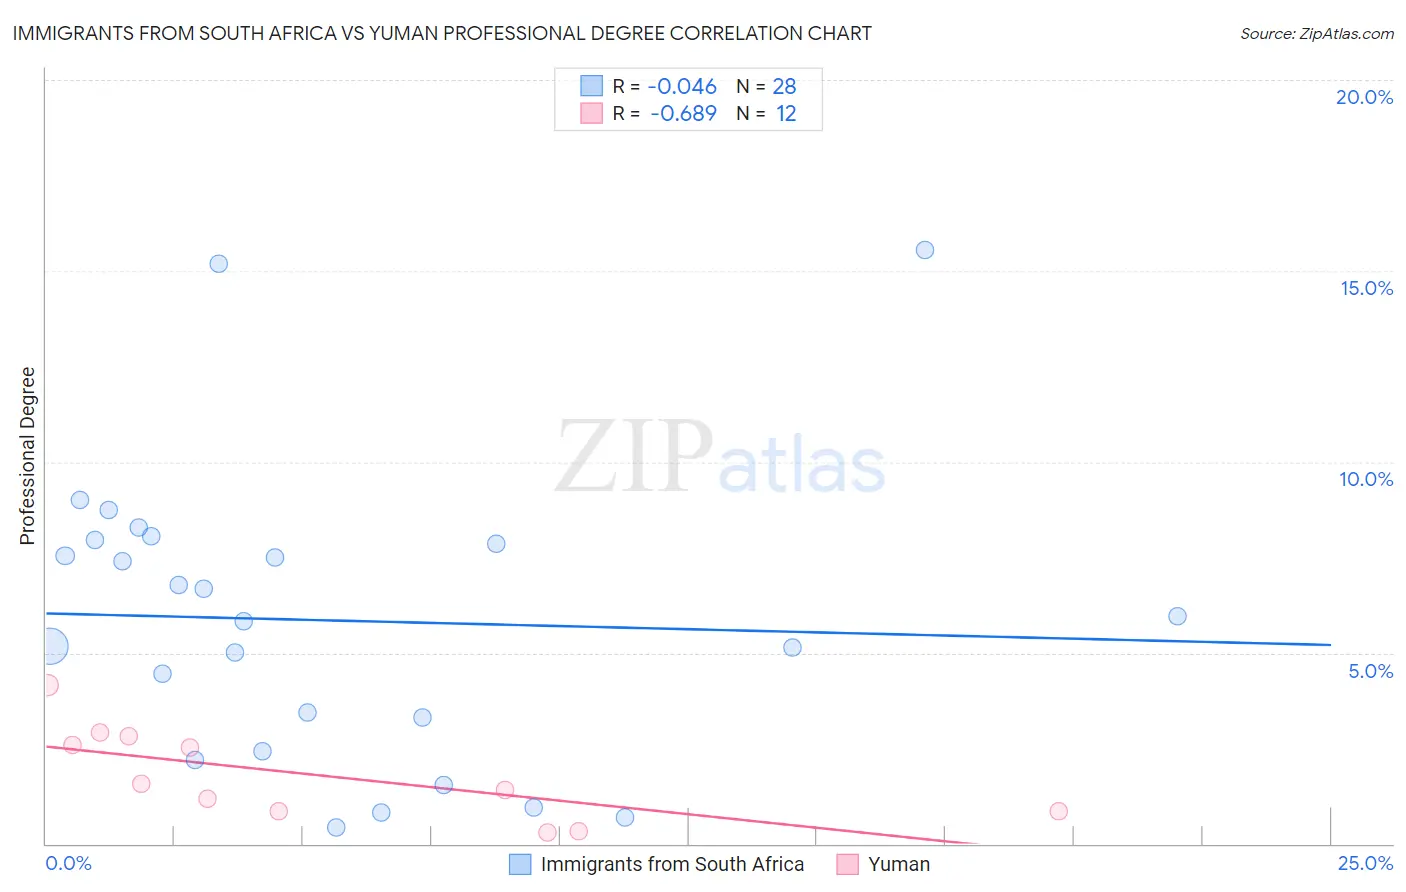
Immigrants from South Africa vs Yuman Professional Degree Correlation Chart
The statistical analysis conducted on geographies consisting of 233,136,921 people shows no correlation between the proportion of Immigrants from South Africa and percentage of population with at least professional degree education in the United States with a correlation coefficient (R) of -0.046 and weighted average of 6.0%. Similarly, the statistical analysis conducted on geographies consisting of 40,606,596 people shows a significant negative correlation between the proportion of Yuman and percentage of population with at least professional degree education in the United States with a correlation coefficient (R) of -0.689 and weighted average of 3.3%, a difference of 83.1%.
Professional Degree Correlation Summary
| Measurement | Immigrants from South Africa | Yuman |
| Minimum | 0.42% | 0.30% |
| Maximum | 15.5% | 4.2% |
| Range | 15.1% | 3.9% |
| Mean | 5.8% | 1.8% |
| Median | 5.9% | 1.5% |
| Interquartile 25% (IQ1) | 2.9% | 0.85% |
| Interquartile 75% (IQ3) | 7.9% | 2.7% |
| Interquartile Range (IQR) | 5.0% | 1.8% |
| Standard Deviation (Sample) | 3.8% | 1.2% |
| Standard Deviation (Population) | 3.7% | 1.1% |
Similar Demographics by Professional Degree
Demographics Similar to Immigrants from South Africa by Professional Degree
In terms of professional degree, the demographic groups most similar to Immigrants from South Africa are Immigrants from Norway (6.0%, a difference of 0.25%), Immigrants from Austria (6.0%, a difference of 0.45%), Cambodian (6.0%, a difference of 0.47%), New Zealander (6.0%, a difference of 0.66%), and Estonian (6.0%, a difference of 0.67%).
| Demographics | Rating | Rank | Professional Degree |
| Thais | 100.0 /100 | #32 | Exceptional 6.1% |
| Burmese | 100.0 /100 | #33 | Exceptional 6.1% |
| Mongolians | 100.0 /100 | #34 | Exceptional 6.1% |
| Immigrants | Korea | 100.0 /100 | #35 | Exceptional 6.1% |
| Immigrants | Russia | 100.0 /100 | #36 | Exceptional 6.0% |
| Immigrants | Austria | 100.0 /100 | #37 | Exceptional 6.0% |
| Immigrants | Norway | 100.0 /100 | #38 | Exceptional 6.0% |
| Immigrants | South Africa | 100.0 /100 | #39 | Exceptional 6.0% |
| Cambodians | 100.0 /100 | #40 | Exceptional 6.0% |
| New Zealanders | 100.0 /100 | #41 | Exceptional 6.0% |
| Estonians | 100.0 /100 | #42 | Exceptional 6.0% |
| Immigrants | Saudi Arabia | 100.0 /100 | #43 | Exceptional 5.9% |
| Argentineans | 100.0 /100 | #44 | Exceptional 5.9% |
| Immigrants | South Central Asia | 100.0 /100 | #45 | Exceptional 5.9% |
| Immigrants | Argentina | 100.0 /100 | #46 | Exceptional 5.9% |
Demographics Similar to Yuman by Professional Degree
In terms of professional degree, the demographic groups most similar to Yuman are Sioux (3.3%, a difference of 0.010%), Mexican American Indian (3.3%, a difference of 0.21%), Cherokee (3.3%, a difference of 0.60%), Immigrants from Latin America (3.3%, a difference of 0.76%), and Immigrants from Laos (3.2%, a difference of 0.89%).
| Demographics | Rating | Rank | Professional Degree |
| Cape Verdeans | 0.1 /100 | #306 | Tragic 3.4% |
| Samoans | 0.1 /100 | #307 | Tragic 3.3% |
| Shoshone | 0.1 /100 | #308 | Tragic 3.3% |
| Pima | 0.1 /100 | #309 | Tragic 3.3% |
| Immigrants | Latin America | 0.1 /100 | #310 | Tragic 3.3% |
| Cherokee | 0.1 /100 | #311 | Tragic 3.3% |
| Sioux | 0.1 /100 | #312 | Tragic 3.3% |
| Yuman | 0.1 /100 | #313 | Tragic 3.3% |
| Mexican American Indians | 0.1 /100 | #314 | Tragic 3.3% |
| Immigrants | Laos | 0.1 /100 | #315 | Tragic 3.2% |
| Puerto Ricans | 0.1 /100 | #316 | Tragic 3.2% |
| Nepalese | 0.1 /100 | #317 | Tragic 3.2% |
| Immigrants | Micronesia | 0.1 /100 | #318 | Tragic 3.2% |
| Choctaw | 0.1 /100 | #319 | Tragic 3.2% |
| Seminole | 0.1 /100 | #320 | Tragic 3.2% |