Immigrants from South Africa vs Immigrants Family Poverty
COMPARE
Immigrants from South Africa
Immigrants
Family Poverty
Family Poverty Comparison
Immigrants from South Africa
Immigrants
8.1%
FAMILY POVERTY
95.9/ 100
METRIC RATING
98th/ 347
METRIC RANK
10.0%
FAMILY POVERTY
3.6/ 100
METRIC RATING
225th/ 347
METRIC RANK
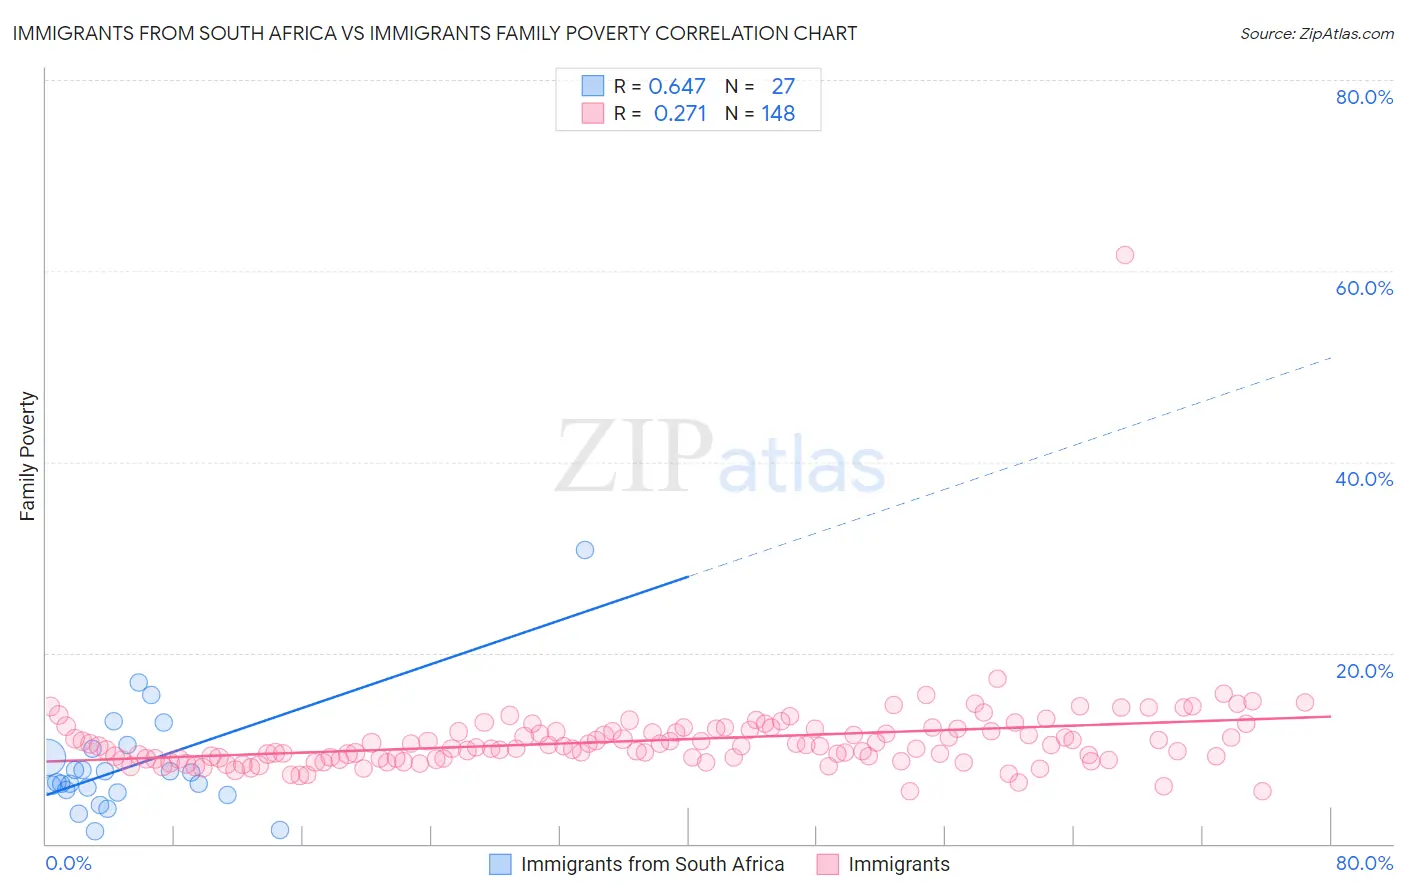
Immigrants from South Africa vs Immigrants Family Poverty Correlation Chart
The statistical analysis conducted on geographies consisting of 232,909,353 people shows a significant positive correlation between the proportion of Immigrants from South Africa and poverty level among families in the United States with a correlation coefficient (R) of 0.647 and weighted average of 8.1%. Similarly, the statistical analysis conducted on geographies consisting of 572,663,107 people shows a weak positive correlation between the proportion of Immigrants and poverty level among families in the United States with a correlation coefficient (R) of 0.271 and weighted average of 10.0%, a difference of 23.5%.
Family Poverty Correlation Summary
| Measurement | Immigrants from South Africa | Immigrants |
| Minimum | 1.3% | 5.5% |
| Maximum | 30.8% | 61.7% |
| Range | 29.4% | 56.2% |
| Mean | 8.3% | 10.8% |
| Median | 6.4% | 10.2% |
| Interquartile 25% (IQ1) | 5.4% | 8.9% |
| Interquartile 75% (IQ3) | 9.9% | 11.9% |
| Interquartile Range (IQR) | 4.5% | 3.0% |
| Standard Deviation (Sample) | 5.9% | 4.7% |
| Standard Deviation (Population) | 5.8% | 4.7% |
Similar Demographics by Family Poverty
Demographics Similar to Immigrants from South Africa by Family Poverty
In terms of family poverty, the demographic groups most similar to Immigrants from South Africa are Welsh (8.1%, a difference of 0.070%), New Zealander (8.1%, a difference of 0.14%), Immigrants from Norway (8.1%, a difference of 0.17%), Immigrants from Indonesia (8.1%, a difference of 0.18%), and Immigrants from Switzerland (8.1%, a difference of 0.21%).
| Demographics | Rating | Rank | Family Poverty |
| Immigrants | Italy | 97.0 /100 | #91 | Exceptional 8.0% |
| Czechoslovakians | 96.8 /100 | #92 | Exceptional 8.0% |
| Tlingit-Haida | 96.7 /100 | #93 | Exceptional 8.0% |
| Immigrants | Pakistan | 96.6 /100 | #94 | Exceptional 8.0% |
| Immigrants | Philippines | 96.5 /100 | #95 | Exceptional 8.0% |
| Immigrants | Turkey | 96.5 /100 | #96 | Exceptional 8.0% |
| Immigrants | Switzerland | 96.1 /100 | #97 | Exceptional 8.1% |
| Immigrants | South Africa | 95.9 /100 | #98 | Exceptional 8.1% |
| Welsh | 95.8 /100 | #99 | Exceptional 8.1% |
| New Zealanders | 95.8 /100 | #100 | Exceptional 8.1% |
| Immigrants | Norway | 95.7 /100 | #101 | Exceptional 8.1% |
| Immigrants | Indonesia | 95.7 /100 | #102 | Exceptional 8.1% |
| Immigrants | Eastern Europe | 95.6 /100 | #103 | Exceptional 8.1% |
| Slavs | 95.6 /100 | #104 | Exceptional 8.1% |
| Laotians | 95.6 /100 | #105 | Exceptional 8.1% |
Demographics Similar to Immigrants by Family Poverty
In terms of family poverty, the demographic groups most similar to Immigrants are Marshallese (9.9%, a difference of 0.25%), Ottawa (10.0%, a difference of 0.27%), Immigrants from Armenia (10.0%, a difference of 0.29%), Sudanese (10.0%, a difference of 0.49%), and Immigrants from Uzbekistan (10.0%, a difference of 0.51%).
| Demographics | Rating | Rank | Family Poverty |
| Panamanians | 5.6 /100 | #218 | Tragic 9.8% |
| Immigrants | Eritrea | 5.4 /100 | #219 | Tragic 9.9% |
| Bermudans | 5.3 /100 | #220 | Tragic 9.9% |
| Immigrants | Cambodia | 4.8 /100 | #221 | Tragic 9.9% |
| Japanese | 4.8 /100 | #222 | Tragic 9.9% |
| Immigrants | Africa | 4.3 /100 | #223 | Tragic 9.9% |
| Marshallese | 3.9 /100 | #224 | Tragic 9.9% |
| Immigrants | Immigrants | 3.6 /100 | #225 | Tragic 10.0% |
| Ottawa | 3.3 /100 | #226 | Tragic 10.0% |
| Immigrants | Armenia | 3.3 /100 | #227 | Tragic 10.0% |
| Sudanese | 3.1 /100 | #228 | Tragic 10.0% |
| Immigrants | Uzbekistan | 3.1 /100 | #229 | Tragic 10.0% |
| Immigrants | Panama | 3.1 /100 | #230 | Tragic 10.0% |
| Alaskan Athabascans | 2.7 /100 | #231 | Tragic 10.1% |
| Immigrants | Sudan | 2.3 /100 | #232 | Tragic 10.1% |