Sri Lankan vs Immigrants Family Poverty
COMPARE
Sri Lankan
Immigrants
Family Poverty
Family Poverty Comparison
Sri Lankans
Immigrants
8.5%
FAMILY POVERTY
86.6/ 100
METRIC RATING
133rd/ 347
METRIC RANK
10.0%
FAMILY POVERTY
3.6/ 100
METRIC RATING
225th/ 347
METRIC RANK
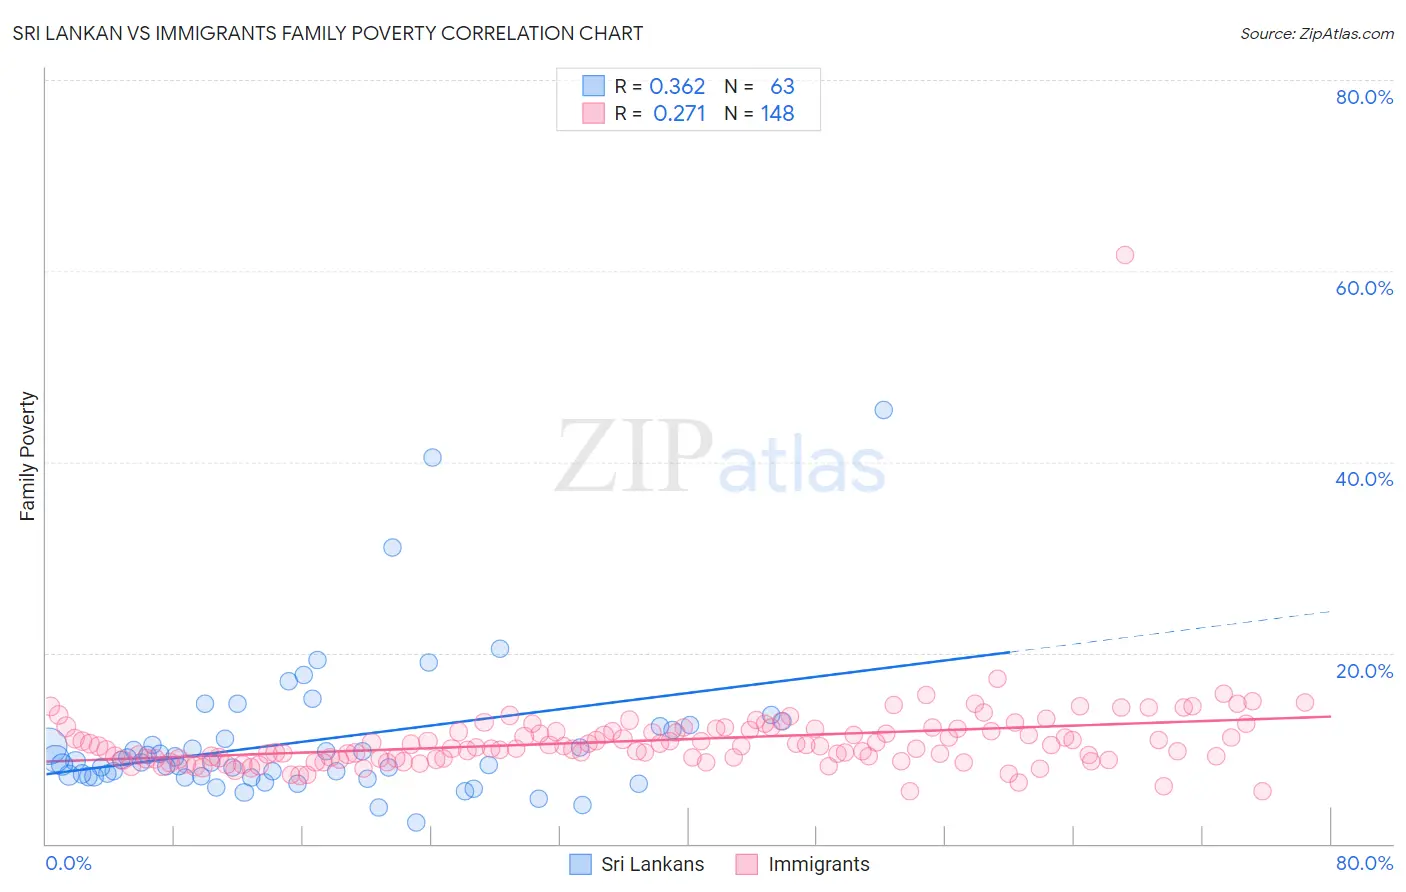
Sri Lankan vs Immigrants Family Poverty Correlation Chart
The statistical analysis conducted on geographies consisting of 439,246,520 people shows a mild positive correlation between the proportion of Sri Lankans and poverty level among families in the United States with a correlation coefficient (R) of 0.362 and weighted average of 8.5%. Similarly, the statistical analysis conducted on geographies consisting of 572,663,107 people shows a weak positive correlation between the proportion of Immigrants and poverty level among families in the United States with a correlation coefficient (R) of 0.271 and weighted average of 10.0%, a difference of 17.9%.
Family Poverty Correlation Summary
| Measurement | Sri Lankan | Immigrants |
| Minimum | 2.3% | 5.5% |
| Maximum | 45.5% | 61.7% |
| Range | 43.2% | 56.2% |
| Mean | 10.8% | 10.8% |
| Median | 8.6% | 10.2% |
| Interquartile 25% (IQ1) | 7.0% | 8.9% |
| Interquartile 75% (IQ3) | 11.9% | 11.9% |
| Interquartile Range (IQR) | 4.8% | 3.0% |
| Standard Deviation (Sample) | 7.5% | 4.7% |
| Standard Deviation (Population) | 7.4% | 4.7% |
Similar Demographics by Family Poverty
Demographics Similar to Sri Lankans by Family Poverty
In terms of family poverty, the demographic groups most similar to Sri Lankans are Chilean (8.5%, a difference of 0.010%), Immigrants from Malaysia (8.5%, a difference of 0.050%), Immigrants from Brazil (8.5%, a difference of 0.090%), Immigrants from Southern Europe (8.5%, a difference of 0.17%), and Immigrants from Argentina (8.4%, a difference of 0.50%).
| Demographics | Rating | Rank | Family Poverty |
| Icelanders | 90.3 /100 | #126 | Exceptional 8.3% |
| Immigrants | Hungary | 89.9 /100 | #127 | Excellent 8.4% |
| Argentineans | 89.6 /100 | #128 | Excellent 8.4% |
| Portuguese | 89.2 /100 | #129 | Excellent 8.4% |
| Immigrants | Bosnia and Herzegovina | 88.6 /100 | #130 | Excellent 8.4% |
| Puget Sound Salish | 88.6 /100 | #131 | Excellent 8.4% |
| Immigrants | Argentina | 88.2 /100 | #132 | Excellent 8.4% |
| Sri Lankans | 86.6 /100 | #133 | Excellent 8.5% |
| Chileans | 86.6 /100 | #134 | Excellent 8.5% |
| Immigrants | Malaysia | 86.5 /100 | #135 | Excellent 8.5% |
| Immigrants | Brazil | 86.3 /100 | #136 | Excellent 8.5% |
| Immigrants | Southern Europe | 86.0 /100 | #137 | Excellent 8.5% |
| Armenians | 84.6 /100 | #138 | Excellent 8.5% |
| Immigrants | Nepal | 84.2 /100 | #139 | Excellent 8.5% |
| Immigrants | Kazakhstan | 84.1 /100 | #140 | Excellent 8.5% |
Demographics Similar to Immigrants by Family Poverty
In terms of family poverty, the demographic groups most similar to Immigrants are Marshallese (9.9%, a difference of 0.25%), Ottawa (10.0%, a difference of 0.27%), Immigrants from Armenia (10.0%, a difference of 0.29%), Sudanese (10.0%, a difference of 0.49%), and Immigrants from Uzbekistan (10.0%, a difference of 0.51%).
| Demographics | Rating | Rank | Family Poverty |
| Panamanians | 5.6 /100 | #218 | Tragic 9.8% |
| Immigrants | Eritrea | 5.4 /100 | #219 | Tragic 9.9% |
| Bermudans | 5.3 /100 | #220 | Tragic 9.9% |
| Immigrants | Cambodia | 4.8 /100 | #221 | Tragic 9.9% |
| Japanese | 4.8 /100 | #222 | Tragic 9.9% |
| Immigrants | Africa | 4.3 /100 | #223 | Tragic 9.9% |
| Marshallese | 3.9 /100 | #224 | Tragic 9.9% |
| Immigrants | Immigrants | 3.6 /100 | #225 | Tragic 10.0% |
| Ottawa | 3.3 /100 | #226 | Tragic 10.0% |
| Immigrants | Armenia | 3.3 /100 | #227 | Tragic 10.0% |
| Sudanese | 3.1 /100 | #228 | Tragic 10.0% |
| Immigrants | Uzbekistan | 3.1 /100 | #229 | Tragic 10.0% |
| Immigrants | Panama | 3.1 /100 | #230 | Tragic 10.0% |
| Alaskan Athabascans | 2.7 /100 | #231 | Tragic 10.1% |
| Immigrants | Sudan | 2.3 /100 | #232 | Tragic 10.1% |