Immigrants from South Africa vs Cape Verdean Family Poverty
COMPARE
Immigrants from South Africa
Cape Verdean
Family Poverty
Family Poverty Comparison
Immigrants from South Africa
Cape Verdeans
8.1%
FAMILY POVERTY
95.9/ 100
METRIC RATING
98th/ 347
METRIC RANK
10.9%
FAMILY POVERTY
0.1/ 100
METRIC RATING
263rd/ 347
METRIC RANK
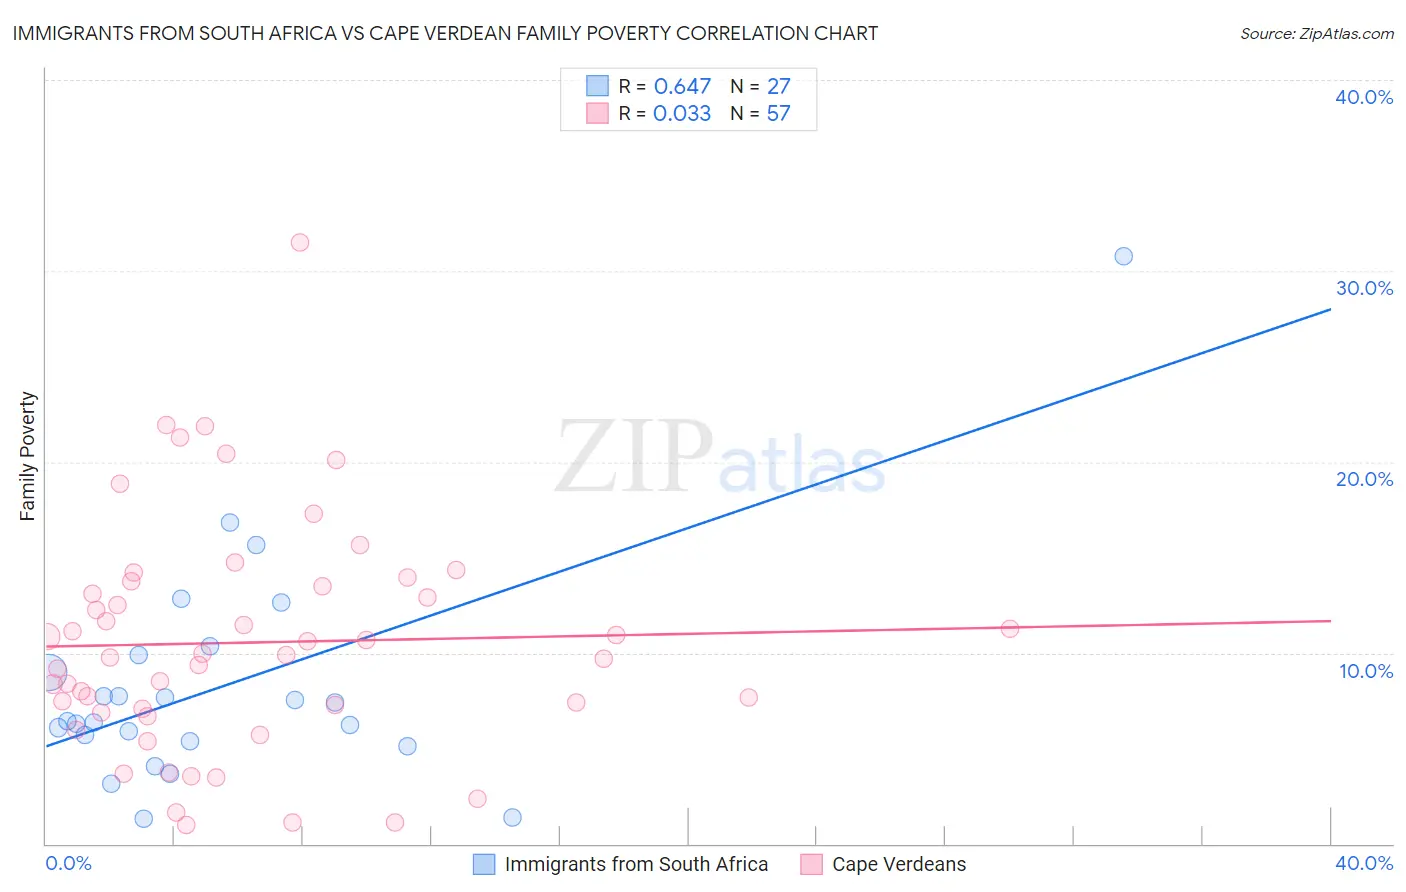
Immigrants from South Africa vs Cape Verdean Family Poverty Correlation Chart
The statistical analysis conducted on geographies consisting of 232,909,353 people shows a significant positive correlation between the proportion of Immigrants from South Africa and poverty level among families in the United States with a correlation coefficient (R) of 0.647 and weighted average of 8.1%. Similarly, the statistical analysis conducted on geographies consisting of 107,439,266 people shows no correlation between the proportion of Cape Verdeans and poverty level among families in the United States with a correlation coefficient (R) of 0.033 and weighted average of 10.9%, a difference of 35.5%.
Family Poverty Correlation Summary
| Measurement | Immigrants from South Africa | Cape Verdean |
| Minimum | 1.3% | 0.95% |
| Maximum | 30.8% | 31.5% |
| Range | 29.4% | 30.5% |
| Mean | 8.3% | 10.5% |
| Median | 6.4% | 9.9% |
| Interquartile 25% (IQ1) | 5.4% | 7.0% |
| Interquartile 75% (IQ3) | 9.9% | 13.6% |
| Interquartile Range (IQR) | 4.5% | 6.6% |
| Standard Deviation (Sample) | 5.9% | 6.0% |
| Standard Deviation (Population) | 5.8% | 6.0% |
Similar Demographics by Family Poverty
Demographics Similar to Immigrants from South Africa by Family Poverty
In terms of family poverty, the demographic groups most similar to Immigrants from South Africa are Welsh (8.1%, a difference of 0.070%), New Zealander (8.1%, a difference of 0.14%), Immigrants from Norway (8.1%, a difference of 0.17%), Immigrants from Indonesia (8.1%, a difference of 0.18%), and Immigrants from Switzerland (8.1%, a difference of 0.21%).
| Demographics | Rating | Rank | Family Poverty |
| Immigrants | Italy | 97.0 /100 | #91 | Exceptional 8.0% |
| Czechoslovakians | 96.8 /100 | #92 | Exceptional 8.0% |
| Tlingit-Haida | 96.7 /100 | #93 | Exceptional 8.0% |
| Immigrants | Pakistan | 96.6 /100 | #94 | Exceptional 8.0% |
| Immigrants | Philippines | 96.5 /100 | #95 | Exceptional 8.0% |
| Immigrants | Turkey | 96.5 /100 | #96 | Exceptional 8.0% |
| Immigrants | Switzerland | 96.1 /100 | #97 | Exceptional 8.1% |
| Immigrants | South Africa | 95.9 /100 | #98 | Exceptional 8.1% |
| Welsh | 95.8 /100 | #99 | Exceptional 8.1% |
| New Zealanders | 95.8 /100 | #100 | Exceptional 8.1% |
| Immigrants | Norway | 95.7 /100 | #101 | Exceptional 8.1% |
| Immigrants | Indonesia | 95.7 /100 | #102 | Exceptional 8.1% |
| Immigrants | Eastern Europe | 95.6 /100 | #103 | Exceptional 8.1% |
| Slavs | 95.6 /100 | #104 | Exceptional 8.1% |
| Laotians | 95.6 /100 | #105 | Exceptional 8.1% |
Demographics Similar to Cape Verdeans by Family Poverty
In terms of family poverty, the demographic groups most similar to Cape Verdeans are Trinidadian and Tobagonian (10.9%, a difference of 0.020%), Immigrants from Trinidad and Tobago (10.9%, a difference of 0.070%), Spanish American Indian (10.9%, a difference of 0.26%), Shoshone (10.9%, a difference of 0.39%), and Bangladeshi (10.9%, a difference of 0.43%).
| Demographics | Rating | Rank | Family Poverty |
| Chickasaw | 0.2 /100 | #256 | Tragic 10.8% |
| Immigrants | Ghana | 0.2 /100 | #257 | Tragic 10.8% |
| Sub-Saharan Africans | 0.2 /100 | #258 | Tragic 10.9% |
| Mexican American Indians | 0.2 /100 | #259 | Tragic 10.9% |
| Bangladeshis | 0.2 /100 | #260 | Tragic 10.9% |
| Shoshone | 0.2 /100 | #261 | Tragic 10.9% |
| Spanish American Indians | 0.2 /100 | #262 | Tragic 10.9% |
| Cape Verdeans | 0.1 /100 | #263 | Tragic 10.9% |
| Trinidadians and Tobagonians | 0.1 /100 | #264 | Tragic 10.9% |
| Immigrants | Trinidad and Tobago | 0.1 /100 | #265 | Tragic 10.9% |
| Immigrants | El Salvador | 0.1 /100 | #266 | Tragic 11.0% |
| Comanche | 0.1 /100 | #267 | Tragic 11.0% |
| Jamaicans | 0.1 /100 | #268 | Tragic 11.1% |
| Immigrants | Ecuador | 0.1 /100 | #269 | Tragic 11.1% |
| Immigrants | Nicaragua | 0.1 /100 | #270 | Tragic 11.1% |