German vs Immigrants Family Poverty
COMPARE
German
Immigrants
Family Poverty
Family Poverty Comparison
Germans
Immigrants
7.7%
FAMILY POVERTY
99.0/ 100
METRIC RATING
44th/ 347
METRIC RANK
10.0%
FAMILY POVERTY
3.6/ 100
METRIC RATING
225th/ 347
METRIC RANK
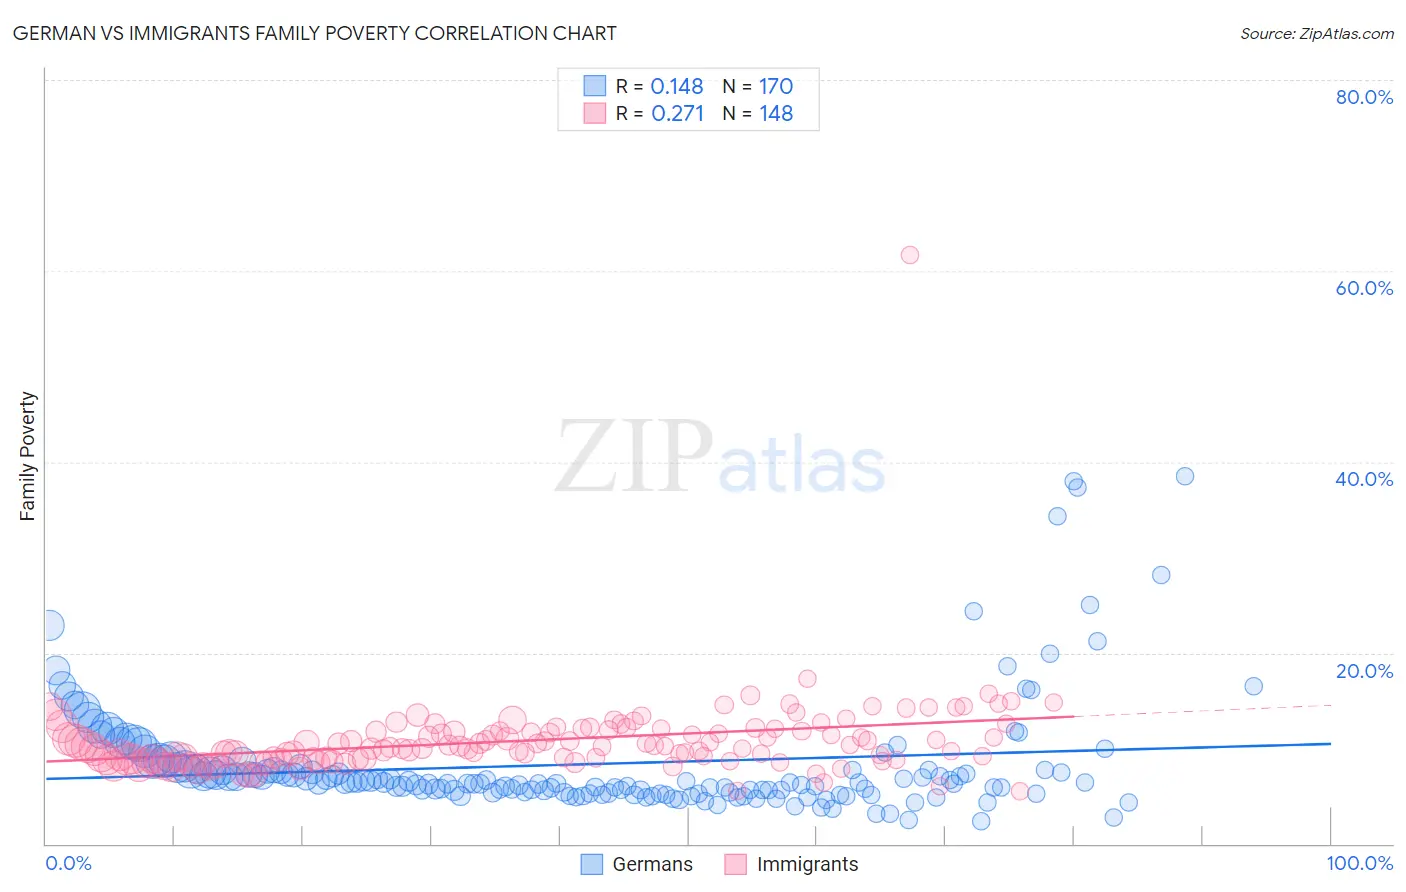
German vs Immigrants Family Poverty Correlation Chart
The statistical analysis conducted on geographies consisting of 575,144,438 people shows a poor positive correlation between the proportion of Germans and poverty level among families in the United States with a correlation coefficient (R) of 0.148 and weighted average of 7.7%. Similarly, the statistical analysis conducted on geographies consisting of 572,663,107 people shows a weak positive correlation between the proportion of Immigrants and poverty level among families in the United States with a correlation coefficient (R) of 0.271 and weighted average of 10.0%, a difference of 30.2%.
Family Poverty Correlation Summary
| Measurement | German | Immigrants |
| Minimum | 2.3% | 5.5% |
| Maximum | 38.5% | 61.7% |
| Range | 36.2% | 56.2% |
| Mean | 8.4% | 10.8% |
| Median | 6.4% | 10.2% |
| Interquartile 25% (IQ1) | 5.4% | 8.9% |
| Interquartile 75% (IQ3) | 7.8% | 11.9% |
| Interquartile Range (IQR) | 2.4% | 3.0% |
| Standard Deviation (Sample) | 6.1% | 4.7% |
| Standard Deviation (Population) | 6.1% | 4.7% |
Similar Demographics by Family Poverty
Demographics Similar to Germans by Family Poverty
In terms of family poverty, the demographic groups most similar to Germans are Okinawan (7.7%, a difference of 0.12%), Tongan (7.7%, a difference of 0.14%), Immigrants from Czechoslovakia (7.7%, a difference of 0.15%), Immigrants from Sri Lanka (7.7%, a difference of 0.17%), and Immigrants from Austria (7.6%, a difference of 0.29%).
| Demographics | Rating | Rank | Family Poverty |
| Estonians | 99.4 /100 | #37 | Exceptional 7.5% |
| Bolivians | 99.3 /100 | #38 | Exceptional 7.5% |
| Carpatho Rusyns | 99.3 /100 | #39 | Exceptional 7.5% |
| Slovenes | 99.3 /100 | #40 | Exceptional 7.5% |
| Immigrants | Australia | 99.2 /100 | #41 | Exceptional 7.6% |
| Scandinavians | 99.1 /100 | #42 | Exceptional 7.6% |
| Immigrants | Austria | 99.1 /100 | #43 | Exceptional 7.6% |
| Germans | 99.0 /100 | #44 | Exceptional 7.7% |
| Okinawans | 98.9 /100 | #45 | Exceptional 7.7% |
| Tongans | 98.9 /100 | #46 | Exceptional 7.7% |
| Immigrants | Czechoslovakia | 98.9 /100 | #47 | Exceptional 7.7% |
| Immigrants | Sri Lanka | 98.9 /100 | #48 | Exceptional 7.7% |
| Immigrants | Bolivia | 98.9 /100 | #49 | Exceptional 7.7% |
| Immigrants | North Macedonia | 98.9 /100 | #50 | Exceptional 7.7% |
| Immigrants | Moldova | 98.8 /100 | #51 | Exceptional 7.7% |
Demographics Similar to Immigrants by Family Poverty
In terms of family poverty, the demographic groups most similar to Immigrants are Marshallese (9.9%, a difference of 0.25%), Ottawa (10.0%, a difference of 0.27%), Immigrants from Armenia (10.0%, a difference of 0.29%), Sudanese (10.0%, a difference of 0.49%), and Immigrants from Uzbekistan (10.0%, a difference of 0.51%).
| Demographics | Rating | Rank | Family Poverty |
| Panamanians | 5.6 /100 | #218 | Tragic 9.8% |
| Immigrants | Eritrea | 5.4 /100 | #219 | Tragic 9.9% |
| Bermudans | 5.3 /100 | #220 | Tragic 9.9% |
| Immigrants | Cambodia | 4.8 /100 | #221 | Tragic 9.9% |
| Japanese | 4.8 /100 | #222 | Tragic 9.9% |
| Immigrants | Africa | 4.3 /100 | #223 | Tragic 9.9% |
| Marshallese | 3.9 /100 | #224 | Tragic 9.9% |
| Immigrants | Immigrants | 3.6 /100 | #225 | Tragic 10.0% |
| Ottawa | 3.3 /100 | #226 | Tragic 10.0% |
| Immigrants | Armenia | 3.3 /100 | #227 | Tragic 10.0% |
| Sudanese | 3.1 /100 | #228 | Tragic 10.0% |
| Immigrants | Uzbekistan | 3.1 /100 | #229 | Tragic 10.0% |
| Immigrants | Panama | 3.1 /100 | #230 | Tragic 10.0% |
| Alaskan Athabascans | 2.7 /100 | #231 | Tragic 10.1% |
| Immigrants | Sudan | 2.3 /100 | #232 | Tragic 10.1% |