Immigrants from Scotland vs Barbadian Male Poverty
COMPARE
Immigrants from Scotland
Barbadian
Male Poverty
Male Poverty Comparison
Immigrants from Scotland
Barbadians
9.6%
MALE POVERTY
99.7/ 100
METRIC RATING
21st/ 347
METRIC RANK
13.6%
MALE POVERTY
0.0/ 100
METRIC RATING
275th/ 347
METRIC RANK
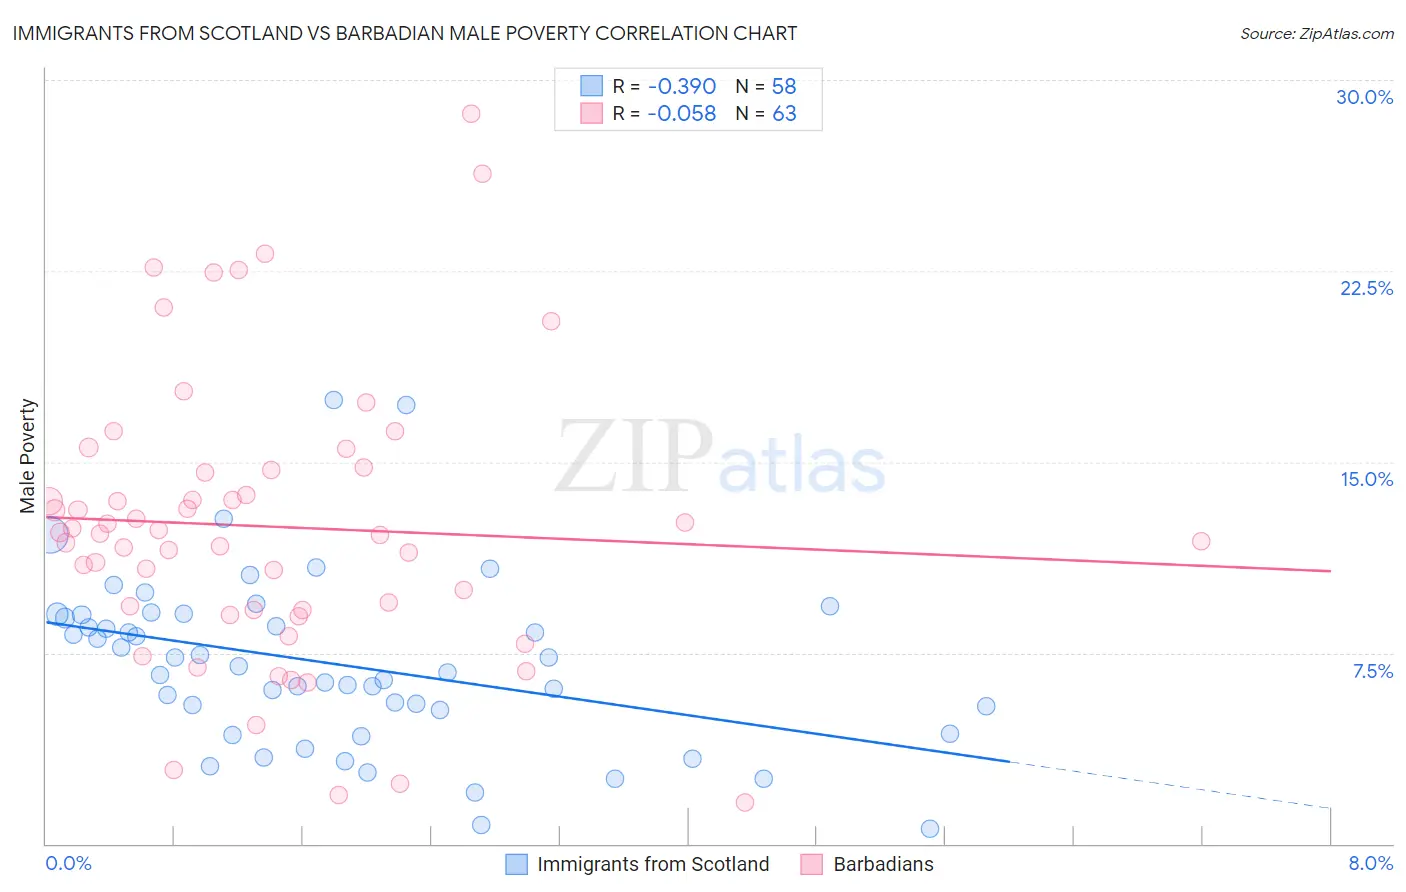
Immigrants from Scotland vs Barbadian Male Poverty Correlation Chart
The statistical analysis conducted on geographies consisting of 196,352,980 people shows a mild negative correlation between the proportion of Immigrants from Scotland and poverty level among males in the United States with a correlation coefficient (R) of -0.390 and weighted average of 9.6%. Similarly, the statistical analysis conducted on geographies consisting of 141,266,401 people shows a slight negative correlation between the proportion of Barbadians and poverty level among males in the United States with a correlation coefficient (R) of -0.058 and weighted average of 13.6%, a difference of 41.6%.
Male Poverty Correlation Summary
| Measurement | Immigrants from Scotland | Barbadian |
| Minimum | 0.60% | 1.6% |
| Maximum | 17.4% | 28.7% |
| Range | 16.8% | 27.1% |
| Mean | 7.1% | 12.5% |
| Median | 6.8% | 12.2% |
| Interquartile 25% (IQ1) | 5.3% | 9.2% |
| Interquartile 75% (IQ3) | 9.0% | 14.7% |
| Interquartile Range (IQR) | 3.7% | 5.5% |
| Standard Deviation (Sample) | 3.4% | 5.6% |
| Standard Deviation (Population) | 3.3% | 5.5% |
Similar Demographics by Male Poverty
Demographics Similar to Immigrants from Scotland by Male Poverty
In terms of male poverty, the demographic groups most similar to Immigrants from Scotland are Croatian (9.6%, a difference of 0.25%), Latvian (9.6%, a difference of 0.26%), Italian (9.6%, a difference of 0.26%), Swedish (9.6%, a difference of 0.34%), and Immigrants from Hong Kong (9.6%, a difference of 0.36%).
| Demographics | Rating | Rank | Male Poverty |
| Immigrants | North Macedonia | 99.8 /100 | #14 | Exceptional 9.4% |
| Bhutanese | 99.8 /100 | #15 | Exceptional 9.5% |
| Luxembourgers | 99.8 /100 | #16 | Exceptional 9.5% |
| Norwegians | 99.8 /100 | #17 | Exceptional 9.5% |
| Lithuanians | 99.8 /100 | #18 | Exceptional 9.5% |
| Immigrants | Hong Kong | 99.7 /100 | #19 | Exceptional 9.6% |
| Latvians | 99.7 /100 | #20 | Exceptional 9.6% |
| Immigrants | Scotland | 99.7 /100 | #21 | Exceptional 9.6% |
| Croatians | 99.7 /100 | #22 | Exceptional 9.6% |
| Italians | 99.7 /100 | #23 | Exceptional 9.6% |
| Swedes | 99.7 /100 | #24 | Exceptional 9.6% |
| Eastern Europeans | 99.6 /100 | #25 | Exceptional 9.6% |
| Burmese | 99.6 /100 | #26 | Exceptional 9.7% |
| Danes | 99.6 /100 | #27 | Exceptional 9.7% |
| Immigrants | Korea | 99.6 /100 | #28 | Exceptional 9.7% |
Demographics Similar to Barbadians by Male Poverty
In terms of male poverty, the demographic groups most similar to Barbadians are Immigrants from Latin America (13.6%, a difference of 0.19%), Bangladeshi (13.6%, a difference of 0.34%), Belizean (13.6%, a difference of 0.44%), Haitian (13.7%, a difference of 0.61%), and Immigrants from West Indies (13.5%, a difference of 0.62%).
| Demographics | Rating | Rank | Male Poverty |
| Sub-Saharan Africans | 0.1 /100 | #268 | Tragic 13.3% |
| Guyanese | 0.0 /100 | #269 | Tragic 13.3% |
| Cree | 0.0 /100 | #270 | Tragic 13.3% |
| Spanish Americans | 0.0 /100 | #271 | Tragic 13.4% |
| Immigrants | Bahamas | 0.0 /100 | #272 | Tragic 13.5% |
| Chickasaw | 0.0 /100 | #273 | Tragic 13.5% |
| Immigrants | West Indies | 0.0 /100 | #274 | Tragic 13.5% |
| Barbadians | 0.0 /100 | #275 | Tragic 13.6% |
| Immigrants | Latin America | 0.0 /100 | #276 | Tragic 13.6% |
| Bangladeshis | 0.0 /100 | #277 | Tragic 13.6% |
| Belizeans | 0.0 /100 | #278 | Tragic 13.6% |
| Haitians | 0.0 /100 | #279 | Tragic 13.7% |
| Mexicans | 0.0 /100 | #280 | Tragic 13.7% |
| Yaqui | 0.0 /100 | #281 | Tragic 13.7% |
| Immigrants | Cabo Verde | 0.0 /100 | #282 | Tragic 13.7% |