Immigrants from Scotland vs Immigrants from Chile Male Poverty
COMPARE
Immigrants from Scotland
Immigrants from Chile
Male Poverty
Male Poverty Comparison
Immigrants from Scotland
Immigrants from Chile
9.6%
MALE POVERTY
99.7/ 100
METRIC RATING
21st/ 347
METRIC RANK
11.1%
MALE POVERTY
57.4/ 100
METRIC RATING
162nd/ 347
METRIC RANK
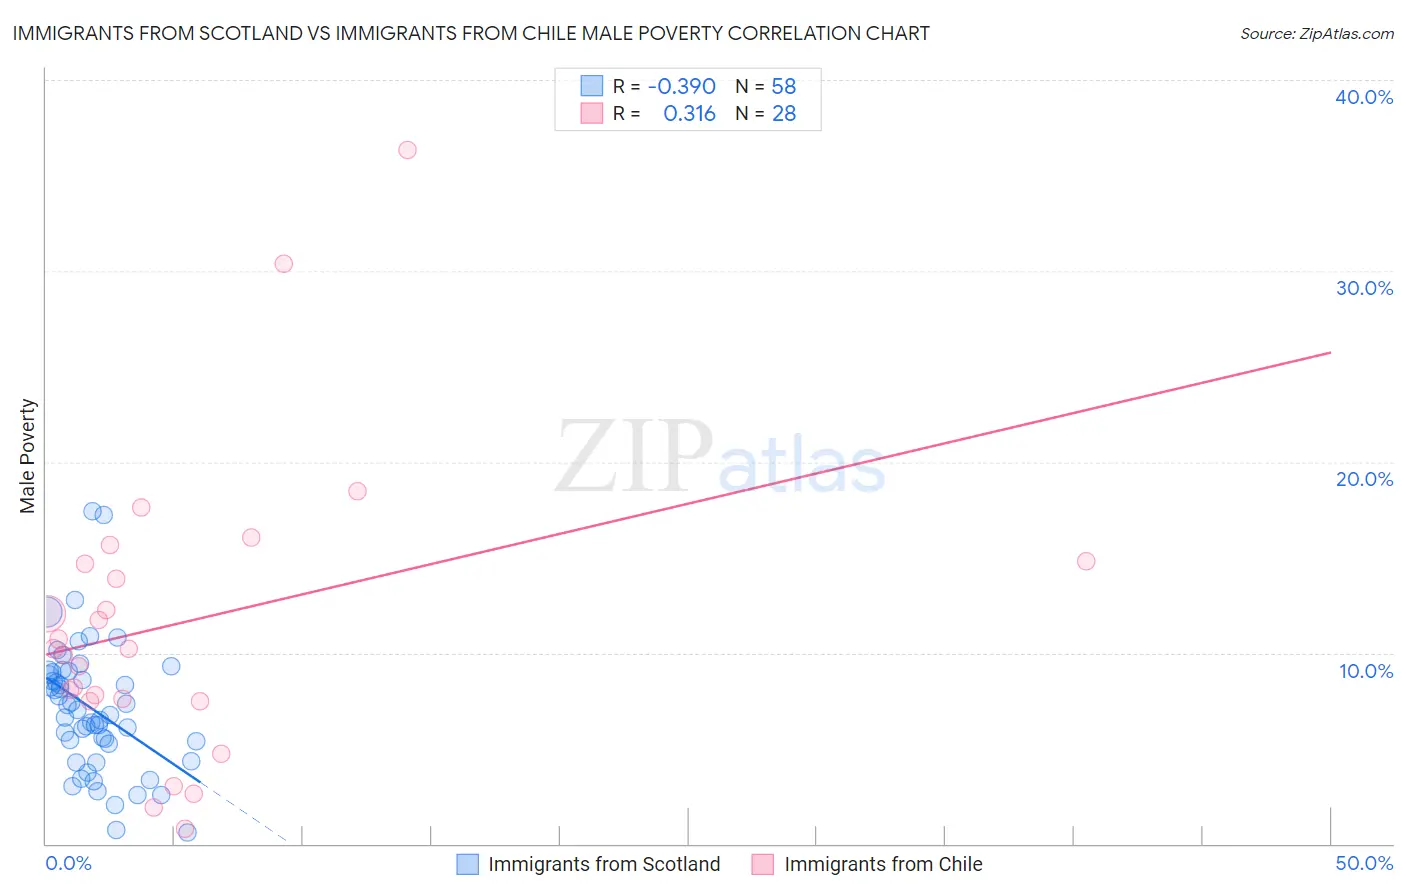
Immigrants from Scotland vs Immigrants from Chile Male Poverty Correlation Chart
The statistical analysis conducted on geographies consisting of 196,352,980 people shows a mild negative correlation between the proportion of Immigrants from Scotland and poverty level among males in the United States with a correlation coefficient (R) of -0.390 and weighted average of 9.6%. Similarly, the statistical analysis conducted on geographies consisting of 218,566,097 people shows a mild positive correlation between the proportion of Immigrants from Chile and poverty level among males in the United States with a correlation coefficient (R) of 0.316 and weighted average of 11.1%, a difference of 15.8%.
Male Poverty Correlation Summary
| Measurement | Immigrants from Scotland | Immigrants from Chile |
| Minimum | 0.60% | 0.80% |
| Maximum | 17.4% | 36.4% |
| Range | 16.8% | 35.6% |
| Mean | 7.1% | 11.6% |
| Median | 6.8% | 10.2% |
| Interquartile 25% (IQ1) | 5.3% | 7.5% |
| Interquartile 75% (IQ3) | 9.0% | 14.8% |
| Interquartile Range (IQR) | 3.7% | 7.2% |
| Standard Deviation (Sample) | 3.4% | 7.8% |
| Standard Deviation (Population) | 3.3% | 7.6% |
Similar Demographics by Male Poverty
Demographics Similar to Immigrants from Scotland by Male Poverty
In terms of male poverty, the demographic groups most similar to Immigrants from Scotland are Croatian (9.6%, a difference of 0.25%), Latvian (9.6%, a difference of 0.26%), Italian (9.6%, a difference of 0.26%), Swedish (9.6%, a difference of 0.34%), and Immigrants from Hong Kong (9.6%, a difference of 0.36%).
| Demographics | Rating | Rank | Male Poverty |
| Immigrants | North Macedonia | 99.8 /100 | #14 | Exceptional 9.4% |
| Bhutanese | 99.8 /100 | #15 | Exceptional 9.5% |
| Luxembourgers | 99.8 /100 | #16 | Exceptional 9.5% |
| Norwegians | 99.8 /100 | #17 | Exceptional 9.5% |
| Lithuanians | 99.8 /100 | #18 | Exceptional 9.5% |
| Immigrants | Hong Kong | 99.7 /100 | #19 | Exceptional 9.6% |
| Latvians | 99.7 /100 | #20 | Exceptional 9.6% |
| Immigrants | Scotland | 99.7 /100 | #21 | Exceptional 9.6% |
| Croatians | 99.7 /100 | #22 | Exceptional 9.6% |
| Italians | 99.7 /100 | #23 | Exceptional 9.6% |
| Swedes | 99.7 /100 | #24 | Exceptional 9.6% |
| Eastern Europeans | 99.6 /100 | #25 | Exceptional 9.6% |
| Burmese | 99.6 /100 | #26 | Exceptional 9.7% |
| Danes | 99.6 /100 | #27 | Exceptional 9.7% |
| Immigrants | Korea | 99.6 /100 | #28 | Exceptional 9.7% |
Demographics Similar to Immigrants from Chile by Male Poverty
In terms of male poverty, the demographic groups most similar to Immigrants from Chile are White/Caucasian (11.1%, a difference of 0.060%), Ethiopian (11.1%, a difference of 0.070%), Immigrants from Spain (11.1%, a difference of 0.19%), Immigrants from Albania (11.1%, a difference of 0.21%), and Hungarian (11.1%, a difference of 0.22%).
| Demographics | Rating | Rank | Male Poverty |
| Immigrants | Malaysia | 64.7 /100 | #155 | Good 11.0% |
| Costa Ricans | 63.9 /100 | #156 | Good 11.0% |
| Scotch-Irish | 63.7 /100 | #157 | Good 11.0% |
| Colombians | 63.0 /100 | #158 | Good 11.0% |
| Taiwanese | 62.7 /100 | #159 | Good 11.0% |
| Soviet Union | 60.3 /100 | #160 | Good 11.1% |
| Immigrants | Northern Africa | 59.7 /100 | #161 | Average 11.1% |
| Immigrants | Chile | 57.4 /100 | #162 | Average 11.1% |
| Whites/Caucasians | 56.7 /100 | #163 | Average 11.1% |
| Ethiopians | 56.7 /100 | #164 | Average 11.1% |
| Immigrants | Spain | 55.5 /100 | #165 | Average 11.1% |
| Immigrants | Albania | 55.3 /100 | #166 | Average 11.1% |
| Hungarians | 55.1 /100 | #167 | Average 11.1% |
| Immigrants | Portugal | 54.9 /100 | #168 | Average 11.1% |
| Immigrants | Colombia | 54.2 /100 | #169 | Average 11.1% |