Immigrants from Philippines vs Tlingit-Haida Female Poverty
COMPARE
Immigrants from Philippines
Tlingit-Haida
Female Poverty
Female Poverty Comparison
Immigrants from Philippines
Tlingit-Haida
12.1%
FEMALE POVERTY
98.7/ 100
METRIC RATING
54th/ 347
METRIC RANK
12.5%
FEMALE POVERTY
94.8/ 100
METRIC RATING
101st/ 347
METRIC RANK
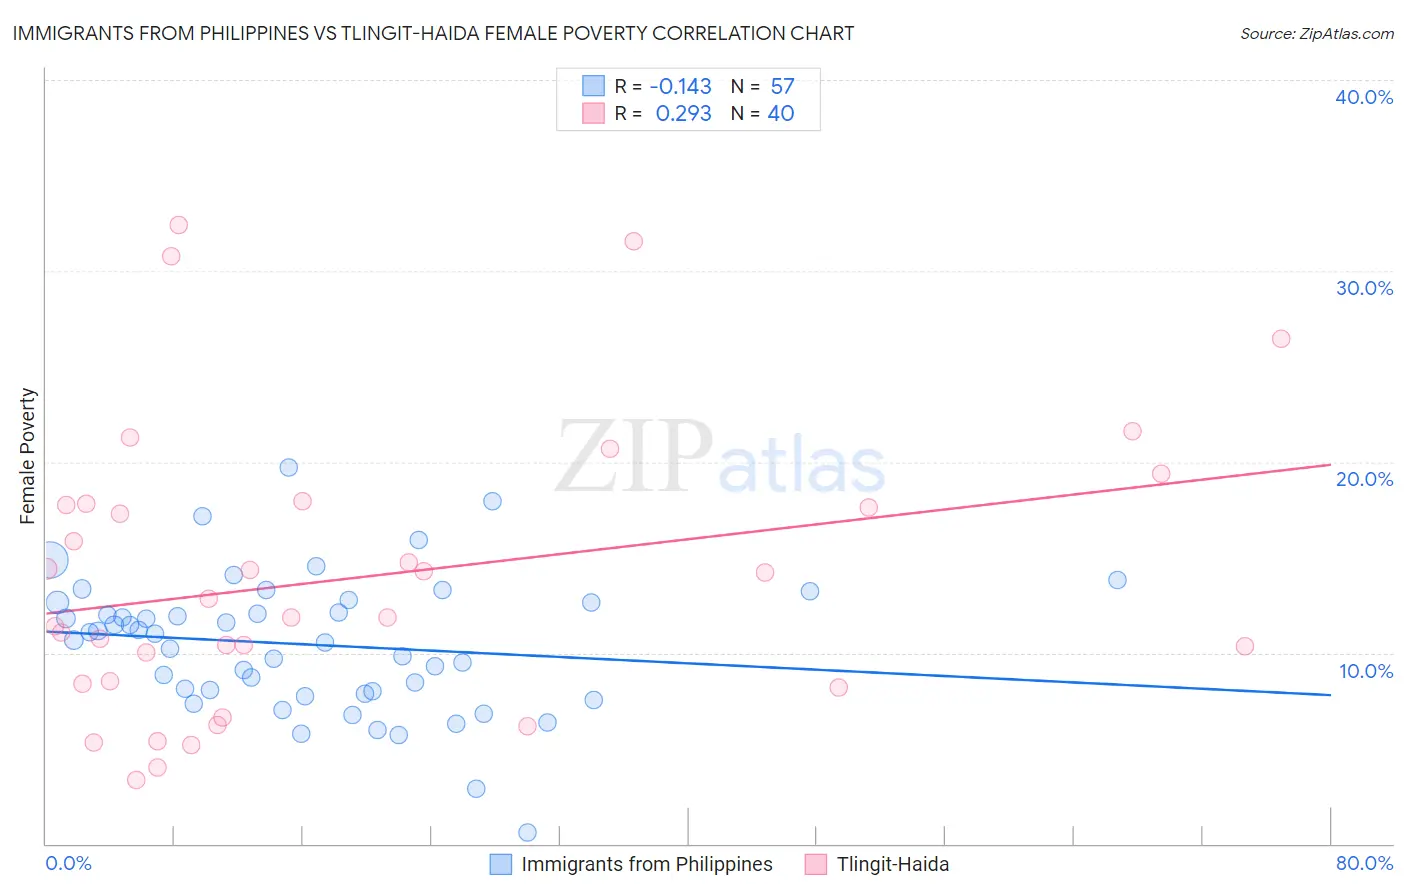
Immigrants from Philippines vs Tlingit-Haida Female Poverty Correlation Chart
The statistical analysis conducted on geographies consisting of 470,914,700 people shows a poor negative correlation between the proportion of Immigrants from Philippines and poverty level among females in the United States with a correlation coefficient (R) of -0.143 and weighted average of 12.1%. Similarly, the statistical analysis conducted on geographies consisting of 60,854,909 people shows a weak positive correlation between the proportion of Tlingit-Haida and poverty level among females in the United States with a correlation coefficient (R) of 0.293 and weighted average of 12.5%, a difference of 3.7%.
Female Poverty Correlation Summary
| Measurement | Immigrants from Philippines | Tlingit-Haida |
| Minimum | 0.57% | 3.4% |
| Maximum | 19.7% | 32.4% |
| Range | 19.2% | 29.1% |
| Mean | 10.4% | 14.0% |
| Median | 11.0% | 12.3% |
| Interquartile 25% (IQ1) | 7.9% | 8.4% |
| Interquartile 75% (IQ3) | 12.6% | 17.8% |
| Interquartile Range (IQR) | 4.7% | 9.3% |
| Standard Deviation (Sample) | 3.5% | 7.4% |
| Standard Deviation (Population) | 3.5% | 7.3% |
Similar Demographics by Female Poverty
Demographics Similar to Immigrants from Philippines by Female Poverty
In terms of female poverty, the demographic groups most similar to Immigrants from Philippines are Immigrants from Austria (12.0%, a difference of 0.14%), Immigrants from Croatia (12.0%, a difference of 0.15%), Immigrants from Sri Lanka (12.1%, a difference of 0.35%), Immigrants from Bulgaria (12.0%, a difference of 0.45%), and Estonian (12.1%, a difference of 0.60%).
| Demographics | Rating | Rank | Female Poverty |
| Asians | 99.1 /100 | #47 | Exceptional 11.9% |
| Immigrants | Japan | 99.0 /100 | #48 | Exceptional 11.9% |
| Immigrants | Romania | 99.0 /100 | #49 | Exceptional 12.0% |
| Slovenes | 98.9 /100 | #50 | Exceptional 12.0% |
| Immigrants | Bulgaria | 98.9 /100 | #51 | Exceptional 12.0% |
| Immigrants | Croatia | 98.7 /100 | #52 | Exceptional 12.0% |
| Immigrants | Austria | 98.7 /100 | #53 | Exceptional 12.0% |
| Immigrants | Philippines | 98.7 /100 | #54 | Exceptional 12.1% |
| Immigrants | Sri Lanka | 98.5 /100 | #55 | Exceptional 12.1% |
| Estonians | 98.3 /100 | #56 | Exceptional 12.1% |
| Immigrants | Serbia | 98.3 /100 | #57 | Exceptional 12.1% |
| Scandinavians | 98.2 /100 | #58 | Exceptional 12.1% |
| Immigrants | Europe | 98.2 /100 | #59 | Exceptional 12.1% |
| Immigrants | Australia | 98.1 /100 | #60 | Exceptional 12.2% |
| Immigrants | Asia | 98.1 /100 | #61 | Exceptional 12.2% |
Demographics Similar to Tlingit-Haida by Female Poverty
In terms of female poverty, the demographic groups most similar to Tlingit-Haida are Immigrants from Latvia (12.5%, a difference of 0.0%), Romanian (12.5%, a difference of 0.15%), Immigrants from China (12.5%, a difference of 0.15%), Native Hawaiian (12.5%, a difference of 0.17%), and Slavic (12.5%, a difference of 0.17%).
| Demographics | Rating | Rank | Female Poverty |
| Immigrants | Indonesia | 95.4 /100 | #94 | Exceptional 12.5% |
| Immigrants | South Africa | 95.4 /100 | #95 | Exceptional 12.5% |
| British | 95.2 /100 | #96 | Exceptional 12.5% |
| Australians | 95.2 /100 | #97 | Exceptional 12.5% |
| Native Hawaiians | 95.1 /100 | #98 | Exceptional 12.5% |
| Romanians | 95.1 /100 | #99 | Exceptional 12.5% |
| Immigrants | Latvia | 94.8 /100 | #100 | Exceptional 12.5% |
| Tlingit-Haida | 94.8 /100 | #101 | Exceptional 12.5% |
| Immigrants | China | 94.5 /100 | #102 | Exceptional 12.5% |
| Slavs | 94.5 /100 | #103 | Exceptional 12.5% |
| Palestinians | 94.3 /100 | #104 | Exceptional 12.5% |
| Scottish | 94.1 /100 | #105 | Exceptional 12.5% |
| Immigrants | Turkey | 93.8 /100 | #106 | Exceptional 12.6% |
| Laotians | 93.4 /100 | #107 | Exceptional 12.6% |
| Portuguese | 93.1 /100 | #108 | Exceptional 12.6% |