Immigrants from Ghana vs Tlingit-Haida Female Poverty
COMPARE
Immigrants from Ghana
Tlingit-Haida
Female Poverty
Female Poverty Comparison
Immigrants from Ghana
Tlingit-Haida
15.3%
FEMALE POVERTY
0.3/ 100
METRIC RATING
248th/ 347
METRIC RANK
12.5%
FEMALE POVERTY
94.8/ 100
METRIC RATING
101st/ 347
METRIC RANK
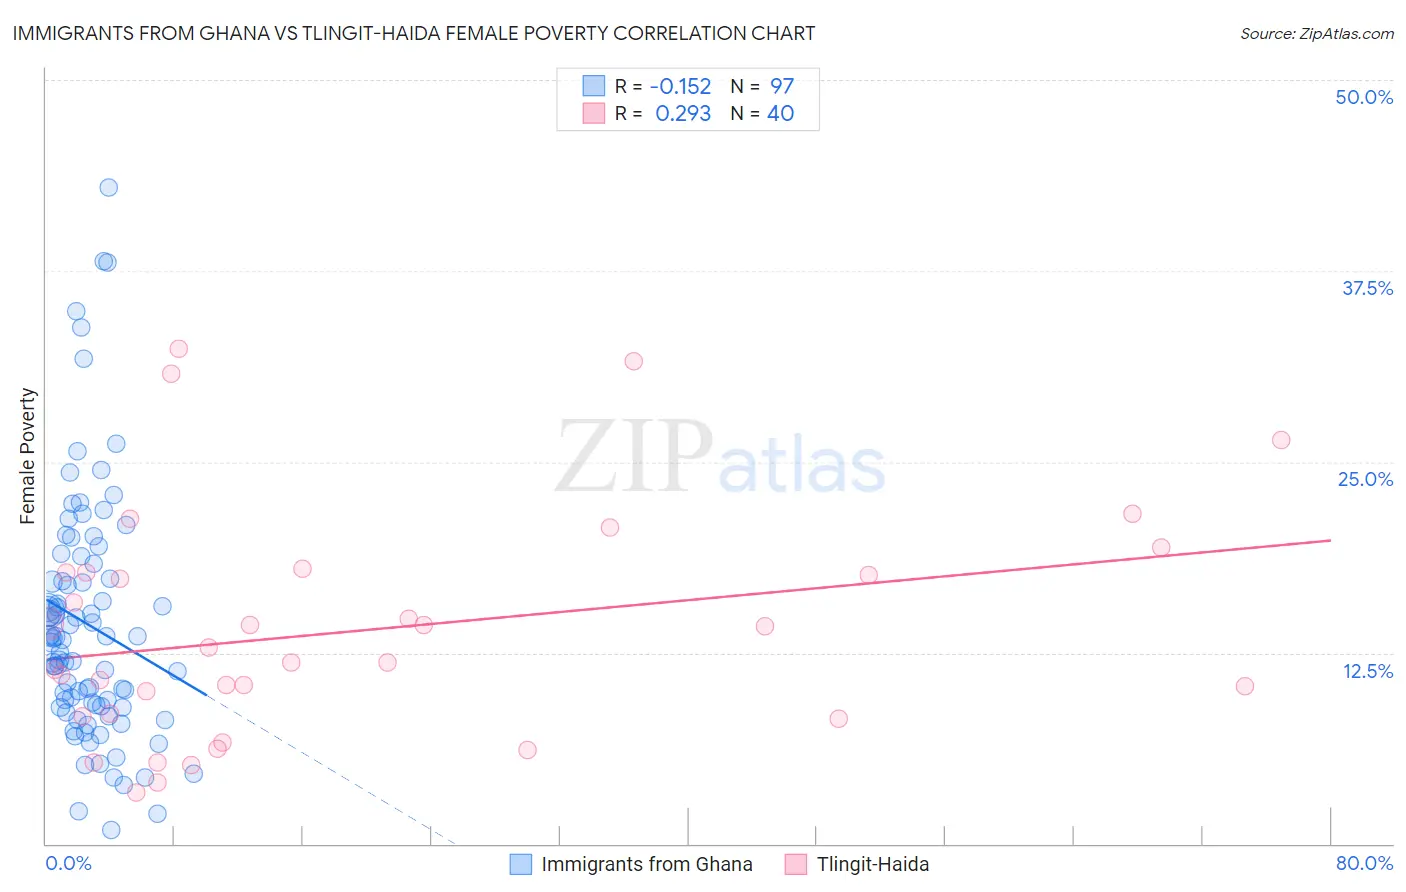
Immigrants from Ghana vs Tlingit-Haida Female Poverty Correlation Chart
The statistical analysis conducted on geographies consisting of 199,796,197 people shows a poor negative correlation between the proportion of Immigrants from Ghana and poverty level among females in the United States with a correlation coefficient (R) of -0.152 and weighted average of 15.3%. Similarly, the statistical analysis conducted on geographies consisting of 60,854,909 people shows a weak positive correlation between the proportion of Tlingit-Haida and poverty level among females in the United States with a correlation coefficient (R) of 0.293 and weighted average of 12.5%, a difference of 22.4%.
Female Poverty Correlation Summary
| Measurement | Immigrants from Ghana | Tlingit-Haida |
| Minimum | 0.90% | 3.4% |
| Maximum | 43.0% | 32.4% |
| Range | 42.1% | 29.1% |
| Mean | 14.3% | 14.0% |
| Median | 13.3% | 12.3% |
| Interquartile 25% (IQ1) | 9.0% | 8.4% |
| Interquartile 75% (IQ3) | 17.8% | 17.8% |
| Interquartile Range (IQR) | 8.9% | 9.3% |
| Standard Deviation (Sample) | 8.1% | 7.4% |
| Standard Deviation (Population) | 8.0% | 7.3% |
Similar Demographics by Female Poverty
Demographics Similar to Immigrants from Ghana by Female Poverty
In terms of female poverty, the demographic groups most similar to Immigrants from Ghana are Potawatomi (15.3%, a difference of 0.0%), Cuban (15.3%, a difference of 0.010%), Spanish American Indian (15.3%, a difference of 0.060%), Salvadoran (15.3%, a difference of 0.14%), and Ecuadorian (15.3%, a difference of 0.16%).
| Demographics | Rating | Rank | Female Poverty |
| Immigrants | Sudan | 0.4 /100 | #241 | Tragic 15.2% |
| Nepalese | 0.4 /100 | #242 | Tragic 15.2% |
| Nicaraguans | 0.3 /100 | #243 | Tragic 15.3% |
| Ecuadorians | 0.3 /100 | #244 | Tragic 15.3% |
| Spanish American Indians | 0.3 /100 | #245 | Tragic 15.3% |
| Cubans | 0.3 /100 | #246 | Tragic 15.3% |
| Potawatomi | 0.3 /100 | #247 | Tragic 15.3% |
| Immigrants | Ghana | 0.3 /100 | #248 | Tragic 15.3% |
| Salvadorans | 0.3 /100 | #249 | Tragic 15.3% |
| Immigrants | Western Africa | 0.3 /100 | #250 | Tragic 15.3% |
| Immigrants | Trinidad and Tobago | 0.3 /100 | #251 | Tragic 15.4% |
| Immigrants | Burma/Myanmar | 0.3 /100 | #252 | Tragic 15.4% |
| Liberians | 0.2 /100 | #253 | Tragic 15.4% |
| Trinidadians and Tobagonians | 0.2 /100 | #254 | Tragic 15.4% |
| Ottawa | 0.2 /100 | #255 | Tragic 15.5% |
Demographics Similar to Tlingit-Haida by Female Poverty
In terms of female poverty, the demographic groups most similar to Tlingit-Haida are Immigrants from Latvia (12.5%, a difference of 0.0%), Romanian (12.5%, a difference of 0.15%), Immigrants from China (12.5%, a difference of 0.15%), Native Hawaiian (12.5%, a difference of 0.17%), and Slavic (12.5%, a difference of 0.17%).
| Demographics | Rating | Rank | Female Poverty |
| Immigrants | Indonesia | 95.4 /100 | #94 | Exceptional 12.5% |
| Immigrants | South Africa | 95.4 /100 | #95 | Exceptional 12.5% |
| British | 95.2 /100 | #96 | Exceptional 12.5% |
| Australians | 95.2 /100 | #97 | Exceptional 12.5% |
| Native Hawaiians | 95.1 /100 | #98 | Exceptional 12.5% |
| Romanians | 95.1 /100 | #99 | Exceptional 12.5% |
| Immigrants | Latvia | 94.8 /100 | #100 | Exceptional 12.5% |
| Tlingit-Haida | 94.8 /100 | #101 | Exceptional 12.5% |
| Immigrants | China | 94.5 /100 | #102 | Exceptional 12.5% |
| Slavs | 94.5 /100 | #103 | Exceptional 12.5% |
| Palestinians | 94.3 /100 | #104 | Exceptional 12.5% |
| Scottish | 94.1 /100 | #105 | Exceptional 12.5% |
| Immigrants | Turkey | 93.8 /100 | #106 | Exceptional 12.6% |
| Laotians | 93.4 /100 | #107 | Exceptional 12.6% |
| Portuguese | 93.1 /100 | #108 | Exceptional 12.6% |