Immigrants from Philippines vs Tlingit-Haida 11th Grade
COMPARE
Immigrants from Philippines
Tlingit-Haida
11th Grade
11th Grade Comparison
Immigrants from Philippines
Tlingit-Haida
91.5%
11TH GRADE
1.0/ 100
METRIC RATING
247th/ 347
METRIC RANK
94.4%
11TH GRADE
100.0/ 100
METRIC RATING
21st/ 347
METRIC RANK
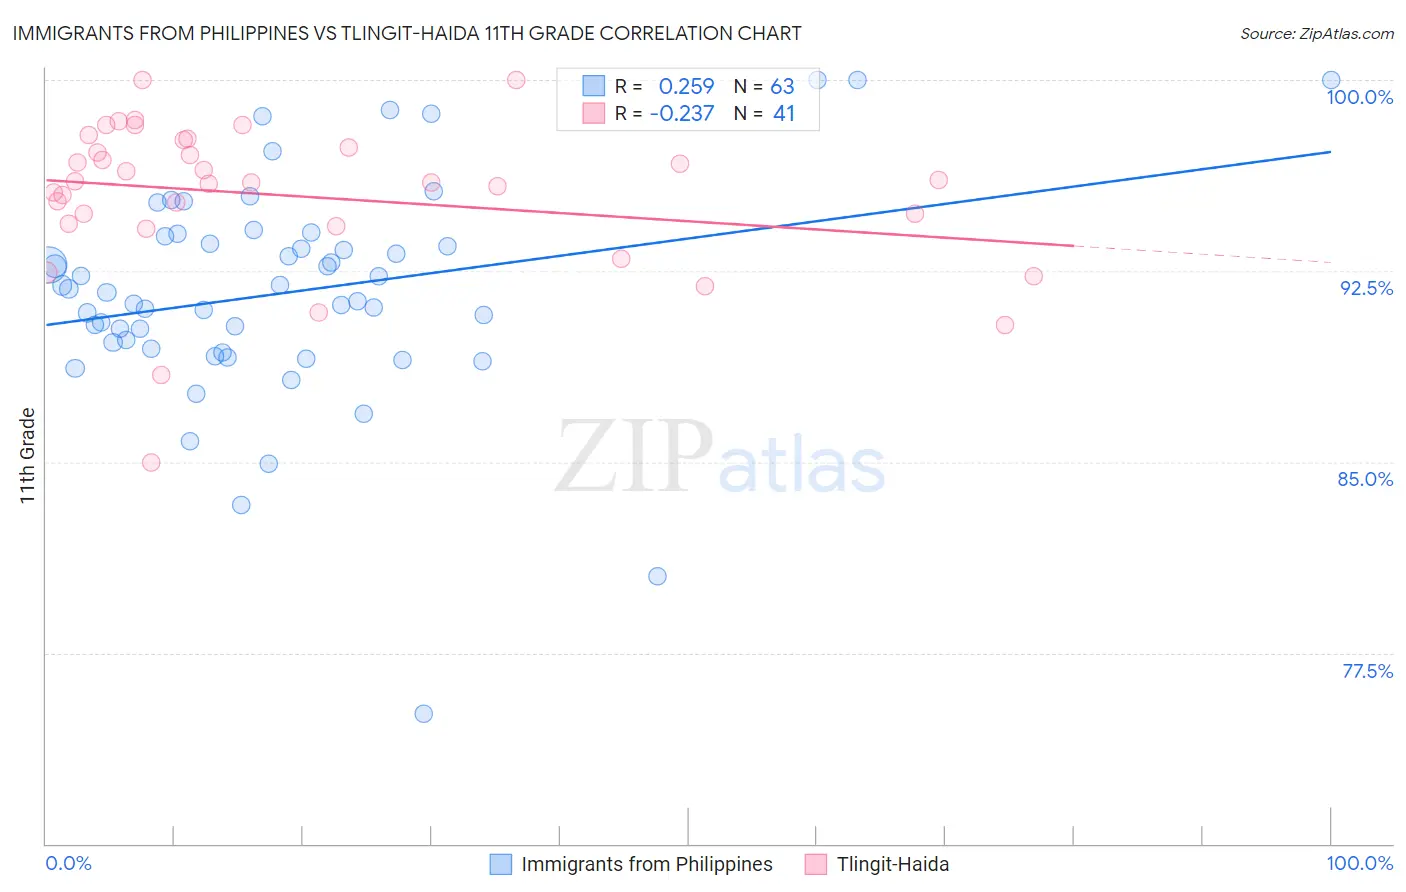
Immigrants from Philippines vs Tlingit-Haida 11th Grade Correlation Chart
The statistical analysis conducted on geographies consisting of 471,300,535 people shows a weak positive correlation between the proportion of Immigrants from Philippines and percentage of population with at least 11th grade education in the United States with a correlation coefficient (R) of 0.259 and weighted average of 91.5%. Similarly, the statistical analysis conducted on geographies consisting of 60,871,919 people shows a weak negative correlation between the proportion of Tlingit-Haida and percentage of population with at least 11th grade education in the United States with a correlation coefficient (R) of -0.237 and weighted average of 94.4%, a difference of 3.3%.
11th Grade Correlation Summary
| Measurement | Immigrants from Philippines | Tlingit-Haida |
| Minimum | 75.1% | 85.0% |
| Maximum | 100.0% | 100.0% |
| Range | 24.9% | 15.0% |
| Mean | 91.6% | 95.4% |
| Median | 91.7% | 96.0% |
| Interquartile 25% (IQ1) | 89.4% | 94.3% |
| Interquartile 75% (IQ3) | 93.9% | 97.5% |
| Interquartile Range (IQR) | 4.4% | 3.2% |
| Standard Deviation (Sample) | 4.3% | 3.0% |
| Standard Deviation (Population) | 4.3% | 3.0% |
Similar Demographics by 11th Grade
Demographics Similar to Immigrants from Philippines by 11th Grade
In terms of 11th grade, the demographic groups most similar to Immigrants from Philippines are Immigrants from Uzbekistan (91.5%, a difference of 0.0%), Peruvian (91.5%, a difference of 0.010%), Ghanaian (91.5%, a difference of 0.010%), Immigrants from Costa Rica (91.4%, a difference of 0.030%), and Seminole (91.5%, a difference of 0.040%).
| Demographics | Rating | Rank | 11th Grade |
| South Americans | 2.0 /100 | #240 | Tragic 91.6% |
| Bahamians | 1.8 /100 | #241 | Tragic 91.6% |
| Immigrants | Middle Africa | 1.6 /100 | #242 | Tragic 91.6% |
| Immigrants | Thailand | 1.4 /100 | #243 | Tragic 91.6% |
| Senegalese | 1.4 /100 | #244 | Tragic 91.6% |
| Africans | 1.3 /100 | #245 | Tragic 91.5% |
| Seminole | 1.2 /100 | #246 | Tragic 91.5% |
| Immigrants | Philippines | 1.0 /100 | #247 | Tragic 91.5% |
| Immigrants | Uzbekistan | 1.0 /100 | #248 | Tragic 91.5% |
| Peruvians | 1.0 /100 | #249 | Tragic 91.5% |
| Ghanaians | 0.9 /100 | #250 | Tragic 91.5% |
| Immigrants | Costa Rica | 0.9 /100 | #251 | Tragic 91.4% |
| Immigrants | Nigeria | 0.8 /100 | #252 | Tragic 91.4% |
| Immigrants | South America | 0.8 /100 | #253 | Tragic 91.4% |
| Immigrants | Eritrea | 0.7 /100 | #254 | Tragic 91.4% |
Demographics Similar to Tlingit-Haida by 11th Grade
In terms of 11th grade, the demographic groups most similar to Tlingit-Haida are Italian (94.5%, a difference of 0.010%), Tsimshian (94.4%, a difference of 0.010%), Czech (94.4%, a difference of 0.010%), English (94.4%, a difference of 0.040%), and Immigrants from India (94.5%, a difference of 0.050%).
| Demographics | Rating | Rank | 11th Grade |
| Eastern Europeans | 100.0 /100 | #14 | Exceptional 94.6% |
| Bulgarians | 100.0 /100 | #15 | Exceptional 94.5% |
| Immigrants | India | 100.0 /100 | #16 | Exceptional 94.5% |
| Luxembourgers | 100.0 /100 | #17 | Exceptional 94.5% |
| Maltese | 100.0 /100 | #18 | Exceptional 94.5% |
| Scandinavians | 100.0 /100 | #19 | Exceptional 94.5% |
| Italians | 100.0 /100 | #20 | Exceptional 94.5% |
| Tlingit-Haida | 100.0 /100 | #21 | Exceptional 94.4% |
| Tsimshian | 100.0 /100 | #22 | Exceptional 94.4% |
| Czechs | 100.0 /100 | #23 | Exceptional 94.4% |
| English | 100.0 /100 | #24 | Exceptional 94.4% |
| Irish | 100.0 /100 | #25 | Exceptional 94.4% |
| Scottish | 100.0 /100 | #26 | Exceptional 94.4% |
| Europeans | 100.0 /100 | #27 | Exceptional 94.4% |
| Estonians | 100.0 /100 | #28 | Exceptional 94.4% |