Immigrants from North America vs Tlingit-Haida Female Poverty
COMPARE
Immigrants from North America
Tlingit-Haida
Female Poverty
Female Poverty Comparison
Immigrants from North America
Tlingit-Haida
12.3%
FEMALE POVERTY
97.1/ 100
METRIC RATING
79th/ 347
METRIC RANK
12.5%
FEMALE POVERTY
94.8/ 100
METRIC RATING
101st/ 347
METRIC RANK
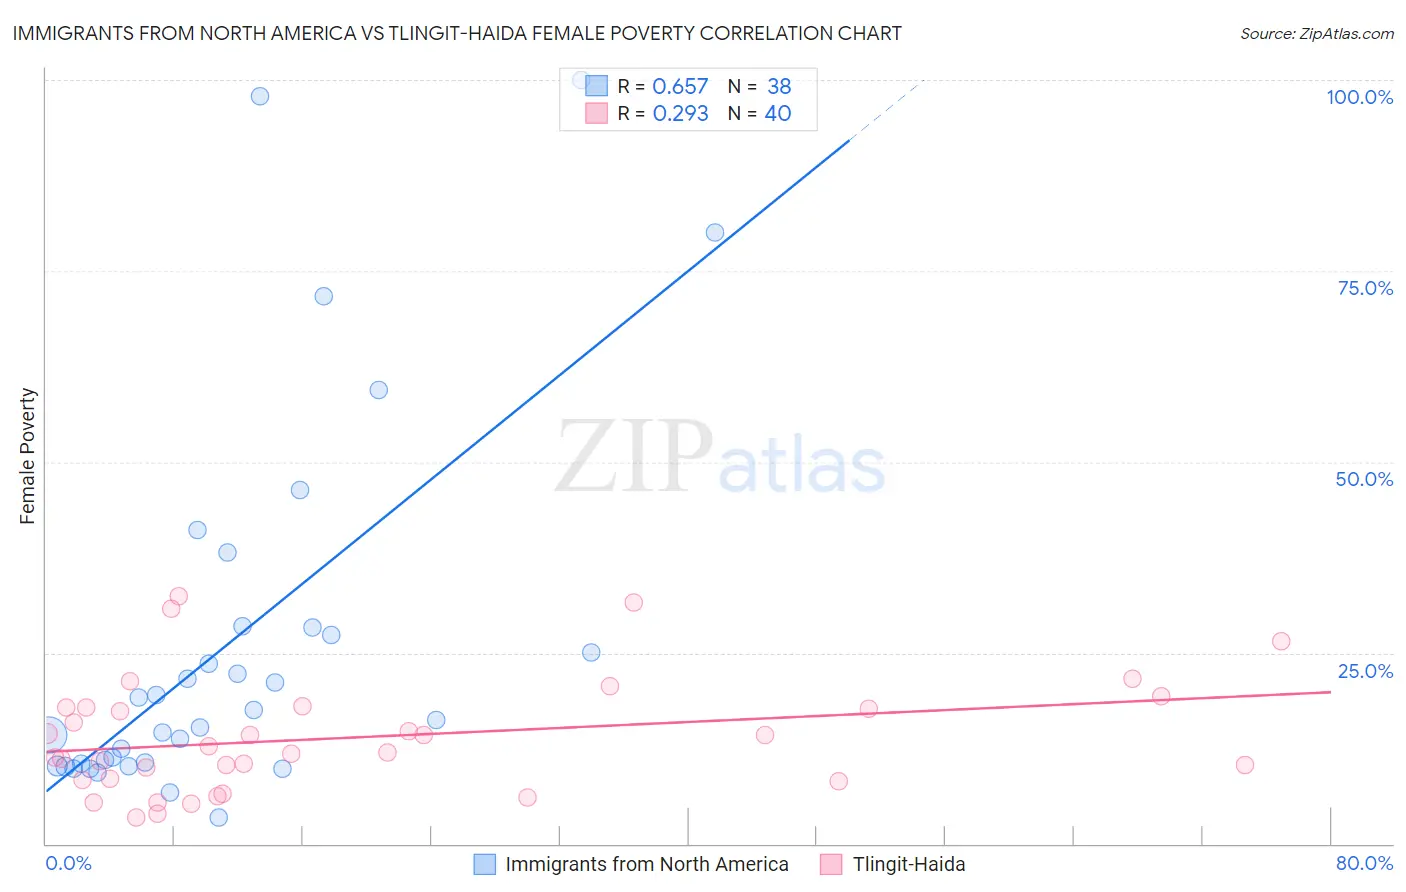
Immigrants from North America vs Tlingit-Haida Female Poverty Correlation Chart
The statistical analysis conducted on geographies consisting of 462,028,692 people shows a significant positive correlation between the proportion of Immigrants from North America and poverty level among females in the United States with a correlation coefficient (R) of 0.657 and weighted average of 12.3%. Similarly, the statistical analysis conducted on geographies consisting of 60,854,909 people shows a weak positive correlation between the proportion of Tlingit-Haida and poverty level among females in the United States with a correlation coefficient (R) of 0.293 and weighted average of 12.5%, a difference of 1.6%.
Female Poverty Correlation Summary
| Measurement | Immigrants from North America | Tlingit-Haida |
| Minimum | 3.5% | 3.4% |
| Maximum | 100.0% | 32.4% |
| Range | 96.5% | 29.1% |
| Mean | 26.2% | 14.0% |
| Median | 16.9% | 12.3% |
| Interquartile 25% (IQ1) | 10.5% | 8.4% |
| Interquartile 75% (IQ3) | 28.3% | 17.8% |
| Interquartile Range (IQR) | 17.9% | 9.3% |
| Standard Deviation (Sample) | 24.5% | 7.4% |
| Standard Deviation (Population) | 24.2% | 7.3% |
Similar Demographics by Female Poverty
Demographics Similar to Immigrants from North America by Female Poverty
In terms of female poverty, the demographic groups most similar to Immigrants from North America are Slovak (12.3%, a difference of 0.050%), Immigrants from Sweden (12.3%, a difference of 0.050%), Jordanian (12.3%, a difference of 0.060%), Egyptian (12.3%, a difference of 0.070%), and Serbian (12.3%, a difference of 0.080%).
| Demographics | Rating | Rank | Female Poverty |
| Cambodians | 97.5 /100 | #72 | Exceptional 12.2% |
| Zimbabweans | 97.5 /100 | #73 | Exceptional 12.3% |
| Immigrants | Canada | 97.5 /100 | #74 | Exceptional 12.3% |
| Europeans | 97.4 /100 | #75 | Exceptional 12.3% |
| Immigrants | Eastern Europe | 97.2 /100 | #76 | Exceptional 12.3% |
| Serbians | 97.2 /100 | #77 | Exceptional 12.3% |
| Egyptians | 97.2 /100 | #78 | Exceptional 12.3% |
| Immigrants | North America | 97.1 /100 | #79 | Exceptional 12.3% |
| Slovaks | 97.1 /100 | #80 | Exceptional 12.3% |
| Immigrants | Sweden | 97.1 /100 | #81 | Exceptional 12.3% |
| Jordanians | 97.1 /100 | #82 | Exceptional 12.3% |
| Immigrants | England | 96.9 /100 | #83 | Exceptional 12.3% |
| Northern Europeans | 96.6 /100 | #84 | Exceptional 12.4% |
| Irish | 96.5 /100 | #85 | Exceptional 12.4% |
| Dutch | 96.5 /100 | #86 | Exceptional 12.4% |
Demographics Similar to Tlingit-Haida by Female Poverty
In terms of female poverty, the demographic groups most similar to Tlingit-Haida are Immigrants from Latvia (12.5%, a difference of 0.0%), Romanian (12.5%, a difference of 0.15%), Immigrants from China (12.5%, a difference of 0.15%), Native Hawaiian (12.5%, a difference of 0.17%), and Slavic (12.5%, a difference of 0.17%).
| Demographics | Rating | Rank | Female Poverty |
| Immigrants | Indonesia | 95.4 /100 | #94 | Exceptional 12.5% |
| Immigrants | South Africa | 95.4 /100 | #95 | Exceptional 12.5% |
| British | 95.2 /100 | #96 | Exceptional 12.5% |
| Australians | 95.2 /100 | #97 | Exceptional 12.5% |
| Native Hawaiians | 95.1 /100 | #98 | Exceptional 12.5% |
| Romanians | 95.1 /100 | #99 | Exceptional 12.5% |
| Immigrants | Latvia | 94.8 /100 | #100 | Exceptional 12.5% |
| Tlingit-Haida | 94.8 /100 | #101 | Exceptional 12.5% |
| Immigrants | China | 94.5 /100 | #102 | Exceptional 12.5% |
| Slavs | 94.5 /100 | #103 | Exceptional 12.5% |
| Palestinians | 94.3 /100 | #104 | Exceptional 12.5% |
| Scottish | 94.1 /100 | #105 | Exceptional 12.5% |
| Immigrants | Turkey | 93.8 /100 | #106 | Exceptional 12.6% |
| Laotians | 93.4 /100 | #107 | Exceptional 12.6% |
| Portuguese | 93.1 /100 | #108 | Exceptional 12.6% |