Immigrants from Peru vs Immigrants from Singapore Ambulatory Disability
COMPARE
Immigrants from Peru
Immigrants from Singapore
Ambulatory Disability
Ambulatory Disability Comparison
Immigrants from Peru
Immigrants from Singapore
5.7%
AMBULATORY DISABILITY
99.4/ 100
METRIC RATING
71st/ 347
METRIC RANK
5.0%
AMBULATORY DISABILITY
100.0/ 100
METRIC RATING
5th/ 347
METRIC RANK
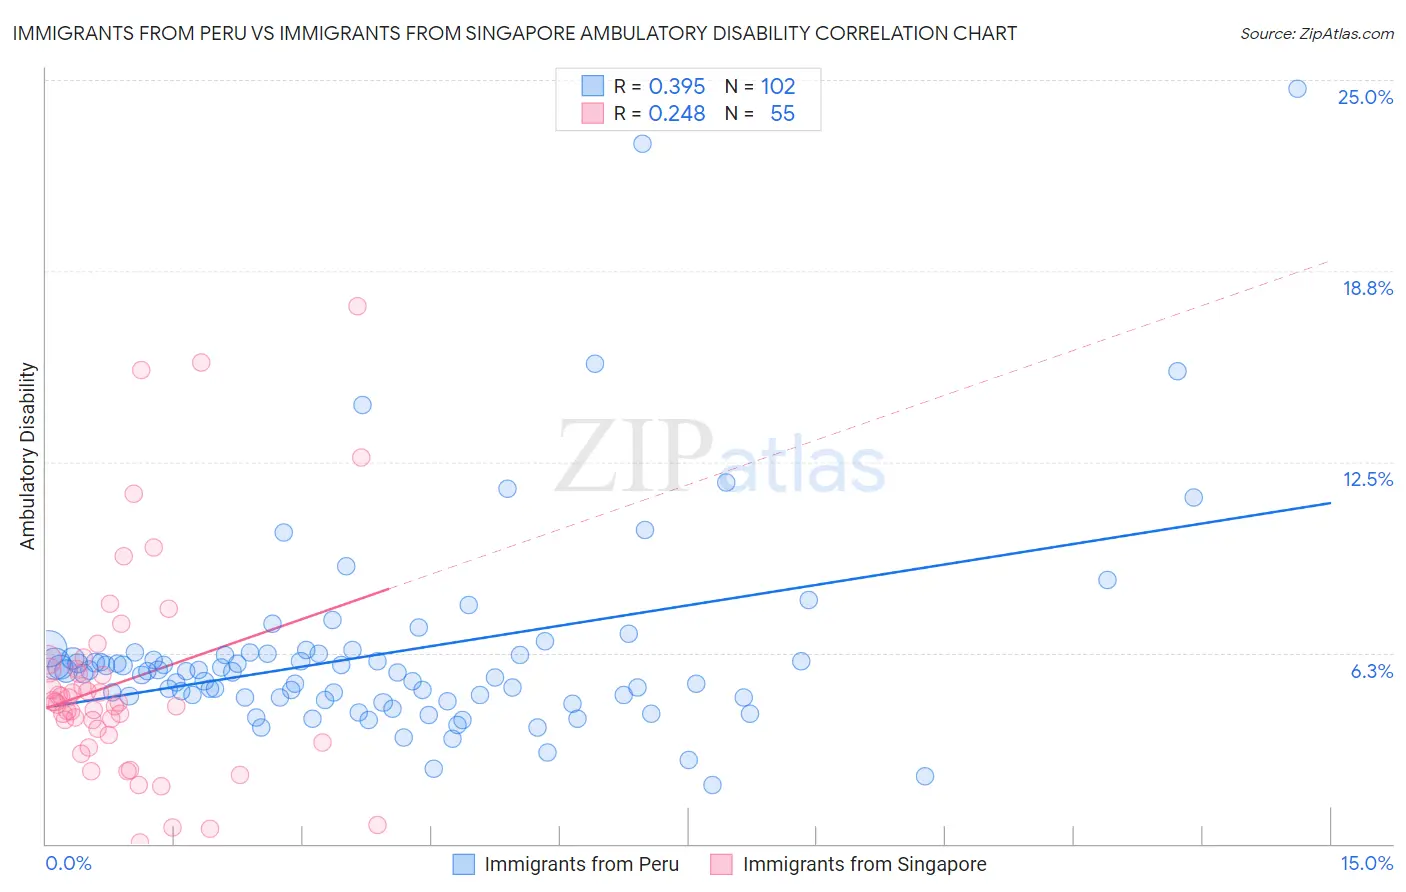
Immigrants from Peru vs Immigrants from Singapore Ambulatory Disability Correlation Chart
The statistical analysis conducted on geographies consisting of 328,808,215 people shows a mild positive correlation between the proportion of Immigrants from Peru and percentage of population with ambulatory disability in the United States with a correlation coefficient (R) of 0.395 and weighted average of 5.7%. Similarly, the statistical analysis conducted on geographies consisting of 137,492,636 people shows a weak positive correlation between the proportion of Immigrants from Singapore and percentage of population with ambulatory disability in the United States with a correlation coefficient (R) of 0.248 and weighted average of 5.0%, a difference of 14.0%.
Ambulatory Disability Correlation Summary
| Measurement | Immigrants from Peru | Immigrants from Singapore |
| Minimum | 1.9% | 0.042% |
| Maximum | 24.7% | 17.6% |
| Range | 22.8% | 17.5% |
| Mean | 6.2% | 5.3% |
| Median | 5.6% | 4.6% |
| Interquartile 25% (IQ1) | 4.8% | 3.6% |
| Interquartile 75% (IQ3) | 6.2% | 5.7% |
| Interquartile Range (IQR) | 1.4% | 2.1% |
| Standard Deviation (Sample) | 3.4% | 3.6% |
| Standard Deviation (Population) | 3.4% | 3.6% |
Similar Demographics by Ambulatory Disability
Demographics Similar to Immigrants from Peru by Ambulatory Disability
In terms of ambulatory disability, the demographic groups most similar to Immigrants from Peru are Brazilian (5.7%, a difference of 0.020%), Immigrants from Northern Africa (5.7%, a difference of 0.040%), Immigrants from Cameroon (5.7%, a difference of 0.040%), Sierra Leonean (5.7%, a difference of 0.090%), and Immigrants from South Africa (5.7%, a difference of 0.090%).
| Demographics | Rating | Rank | Ambulatory Disability |
| Laotians | 99.7 /100 | #64 | Exceptional 5.7% |
| Immigrants | Switzerland | 99.7 /100 | #65 | Exceptional 5.7% |
| Israelis | 99.6 /100 | #66 | Exceptional 5.7% |
| Immigrants | Uganda | 99.6 /100 | #67 | Exceptional 5.7% |
| Sri Lankans | 99.6 /100 | #68 | Exceptional 5.7% |
| Peruvians | 99.5 /100 | #69 | Exceptional 5.7% |
| Sierra Leoneans | 99.4 /100 | #70 | Exceptional 5.7% |
| Immigrants | Peru | 99.4 /100 | #71 | Exceptional 5.7% |
| Brazilians | 99.4 /100 | #72 | Exceptional 5.7% |
| Immigrants | Northern Africa | 99.4 /100 | #73 | Exceptional 5.7% |
| Immigrants | Cameroon | 99.4 /100 | #74 | Exceptional 5.7% |
| Immigrants | South Africa | 99.3 /100 | #75 | Exceptional 5.7% |
| Sudanese | 99.3 /100 | #76 | Exceptional 5.7% |
| Immigrants | Vietnam | 99.3 /100 | #77 | Exceptional 5.7% |
| Somalis | 99.2 /100 | #78 | Exceptional 5.7% |
Demographics Similar to Immigrants from Singapore by Ambulatory Disability
In terms of ambulatory disability, the demographic groups most similar to Immigrants from Singapore are Immigrants from Bolivia (5.0%, a difference of 0.68%), Bolivian (5.1%, a difference of 1.1%), Immigrants from Taiwan (4.9%, a difference of 1.4%), Thai (4.9%, a difference of 1.6%), and Immigrants from South Central Asia (5.1%, a difference of 2.1%).
| Demographics | Rating | Rank | Ambulatory Disability |
| Immigrants | India | 100.0 /100 | #1 | Exceptional 4.8% |
| Filipinos | 100.0 /100 | #2 | Exceptional 4.9% |
| Thais | 100.0 /100 | #3 | Exceptional 4.9% |
| Immigrants | Taiwan | 100.0 /100 | #4 | Exceptional 4.9% |
| Immigrants | Singapore | 100.0 /100 | #5 | Exceptional 5.0% |
| Immigrants | Bolivia | 100.0 /100 | #6 | Exceptional 5.0% |
| Bolivians | 100.0 /100 | #7 | Exceptional 5.1% |
| Immigrants | South Central Asia | 100.0 /100 | #8 | Exceptional 5.1% |
| Iranians | 100.0 /100 | #9 | Exceptional 5.1% |
| Yup'ik | 100.0 /100 | #10 | Exceptional 5.2% |
| Immigrants | Korea | 100.0 /100 | #11 | Exceptional 5.2% |
| Okinawans | 100.0 /100 | #12 | Exceptional 5.3% |
| Burmese | 100.0 /100 | #13 | Exceptional 5.3% |
| Immigrants | Eastern Asia | 100.0 /100 | #14 | Exceptional 5.3% |
| Immigrants | China | 100.0 /100 | #15 | Exceptional 5.3% |