Panamanian vs Immigrants from Singapore Female Poverty
COMPARE
Panamanian
Immigrants from Singapore
Female Poverty
Female Poverty Comparison
Panamanians
Immigrants from Singapore
14.2%
FEMALE POVERTY
7.7/ 100
METRIC RATING
209th/ 347
METRIC RANK
11.8%
FEMALE POVERTY
99.4/ 100
METRIC RATING
34th/ 347
METRIC RANK
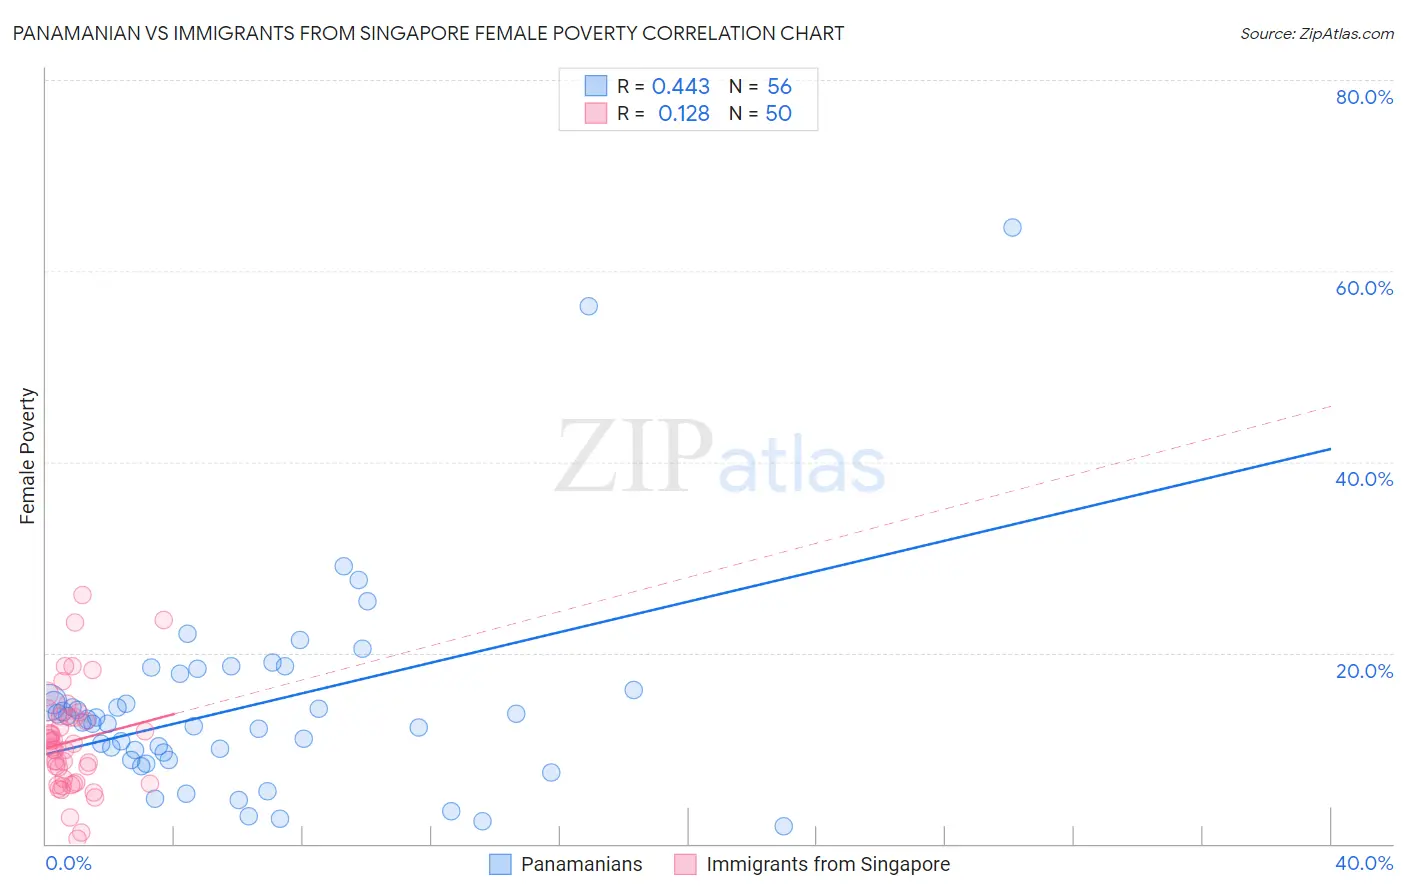
Panamanian vs Immigrants from Singapore Female Poverty Correlation Chart
The statistical analysis conducted on geographies consisting of 281,053,413 people shows a moderate positive correlation between the proportion of Panamanians and poverty level among females in the United States with a correlation coefficient (R) of 0.443 and weighted average of 14.2%. Similarly, the statistical analysis conducted on geographies consisting of 137,378,092 people shows a poor positive correlation between the proportion of Immigrants from Singapore and poverty level among females in the United States with a correlation coefficient (R) of 0.128 and weighted average of 11.8%, a difference of 21.1%.
Female Poverty Correlation Summary
| Measurement | Panamanian | Immigrants from Singapore |
| Minimum | 1.9% | 0.53% |
| Maximum | 64.6% | 26.0% |
| Range | 62.7% | 25.5% |
| Mean | 14.4% | 10.7% |
| Median | 12.9% | 10.3% |
| Interquartile 25% (IQ1) | 9.2% | 6.4% |
| Interquartile 75% (IQ3) | 17.0% | 13.2% |
| Interquartile Range (IQR) | 7.8% | 6.9% |
| Standard Deviation (Sample) | 10.8% | 5.4% |
| Standard Deviation (Population) | 10.7% | 5.3% |
Similar Demographics by Female Poverty
Demographics Similar to Panamanians by Female Poverty
In terms of female poverty, the demographic groups most similar to Panamanians are Immigrants from the Azores (14.2%, a difference of 0.060%), Malaysian (14.3%, a difference of 0.080%), Moroccan (14.3%, a difference of 0.17%), Immigrants from Eastern Africa (14.2%, a difference of 0.41%), and Bermudan (14.4%, a difference of 0.80%).
| Demographics | Rating | Rank | Female Poverty |
| Hmong | 21.1 /100 | #202 | Fair 13.9% |
| Immigrants | Western Asia | 20.7 /100 | #203 | Fair 13.9% |
| Spaniards | 18.9 /100 | #204 | Poor 13.9% |
| Ugandans | 15.4 /100 | #205 | Poor 14.0% |
| Immigrants | Uruguay | 14.0 /100 | #206 | Poor 14.0% |
| Immigrants | Eastern Africa | 9.0 /100 | #207 | Tragic 14.2% |
| Immigrants | Azores | 7.9 /100 | #208 | Tragic 14.2% |
| Panamanians | 7.7 /100 | #209 | Tragic 14.2% |
| Malaysians | 7.4 /100 | #210 | Tragic 14.3% |
| Moroccans | 7.2 /100 | #211 | Tragic 14.3% |
| Bermudans | 5.5 /100 | #212 | Tragic 14.4% |
| Alaskan Athabascans | 5.3 /100 | #213 | Tragic 14.4% |
| Marshallese | 5.0 /100 | #214 | Tragic 14.4% |
| Immigrants | Panama | 4.7 /100 | #215 | Tragic 14.4% |
| Immigrants | Thailand | 4.5 /100 | #216 | Tragic 14.4% |
Demographics Similar to Immigrants from Singapore by Female Poverty
In terms of female poverty, the demographic groups most similar to Immigrants from Singapore are Cypriot (11.8%, a difference of 0.12%), Immigrants from Iran (11.8%, a difference of 0.17%), Danish (11.7%, a difference of 0.19%), Polish (11.7%, a difference of 0.32%), and Immigrants from Pakistan (11.8%, a difference of 0.34%).
| Demographics | Rating | Rank | Female Poverty |
| Iranians | 99.6 /100 | #27 | Exceptional 11.7% |
| Immigrants | Korea | 99.6 /100 | #28 | Exceptional 11.7% |
| Immigrants | North Macedonia | 99.6 /100 | #29 | Exceptional 11.7% |
| Greeks | 99.5 /100 | #30 | Exceptional 11.7% |
| Poles | 99.5 /100 | #31 | Exceptional 11.7% |
| Danes | 99.5 /100 | #32 | Exceptional 11.7% |
| Cypriots | 99.5 /100 | #33 | Exceptional 11.8% |
| Immigrants | Singapore | 99.4 /100 | #34 | Exceptional 11.8% |
| Immigrants | Iran | 99.4 /100 | #35 | Exceptional 11.8% |
| Immigrants | Pakistan | 99.4 /100 | #36 | Exceptional 11.8% |
| Immigrants | Greece | 99.3 /100 | #37 | Exceptional 11.8% |
| Russians | 99.3 /100 | #38 | Exceptional 11.8% |
| Immigrants | Poland | 99.3 /100 | #39 | Exceptional 11.8% |
| Macedonians | 99.3 /100 | #40 | Exceptional 11.8% |
| Czechs | 99.2 /100 | #41 | Exceptional 11.9% |