Estonian vs Immigrants from Cambodia Female Poverty
COMPARE
Estonian
Immigrants from Cambodia
Female Poverty
Female Poverty Comparison
Estonians
Immigrants from Cambodia
12.1%
FEMALE POVERTY
98.3/ 100
METRIC RATING
56th/ 347
METRIC RANK
14.5%
FEMALE POVERTY
3.7/ 100
METRIC RATING
221st/ 347
METRIC RANK
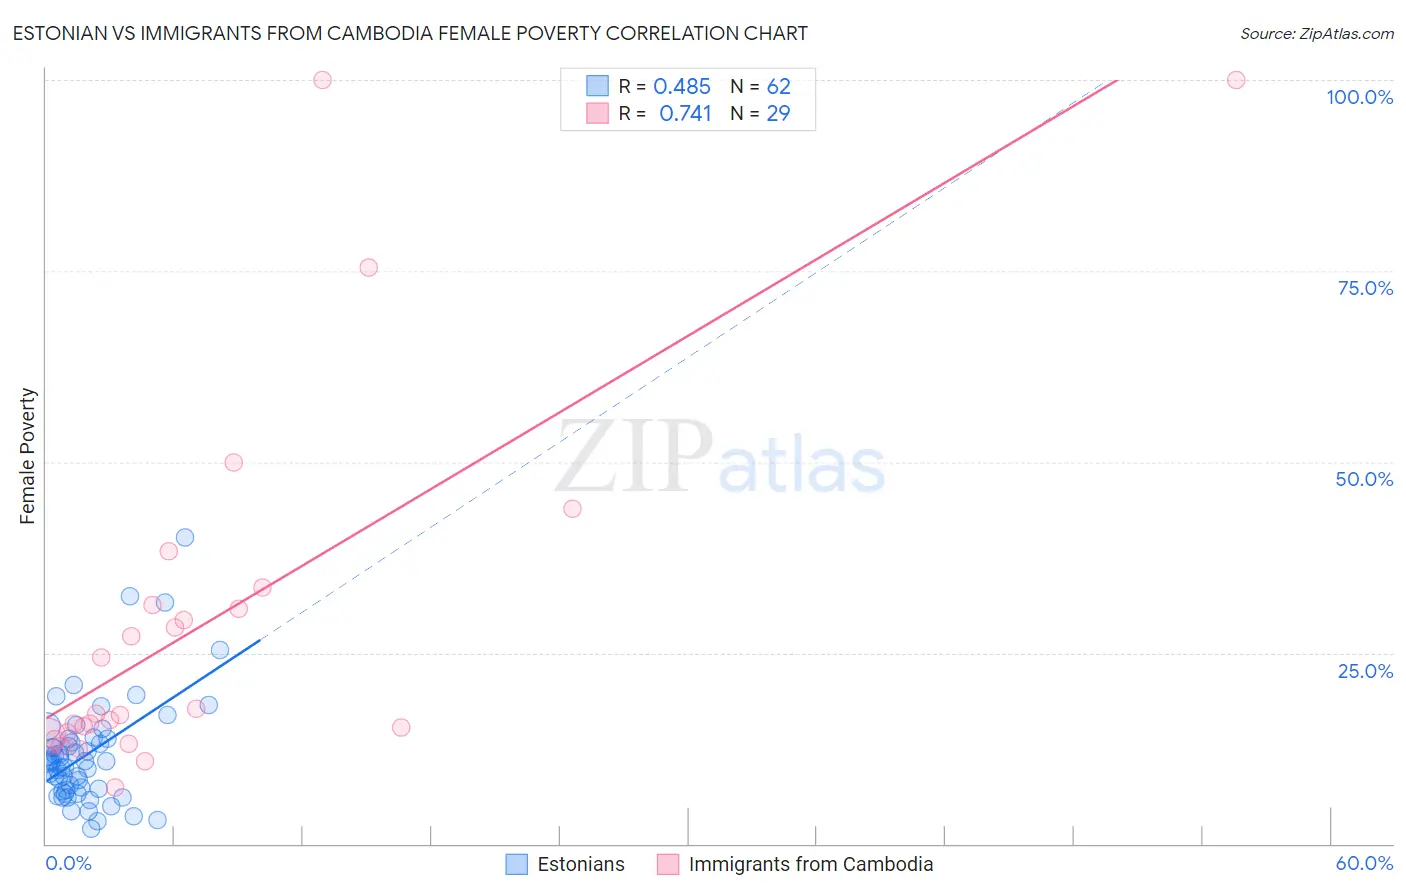
Estonian vs Immigrants from Cambodia Female Poverty Correlation Chart
The statistical analysis conducted on geographies consisting of 123,486,564 people shows a moderate positive correlation between the proportion of Estonians and poverty level among females in the United States with a correlation coefficient (R) of 0.485 and weighted average of 12.1%. Similarly, the statistical analysis conducted on geographies consisting of 205,118,115 people shows a strong positive correlation between the proportion of Immigrants from Cambodia and poverty level among females in the United States with a correlation coefficient (R) of 0.741 and weighted average of 14.5%, a difference of 19.5%.
Female Poverty Correlation Summary
| Measurement | Estonian | Immigrants from Cambodia |
| Minimum | 1.9% | 7.4% |
| Maximum | 40.1% | 100.0% |
| Range | 38.2% | 92.6% |
| Mean | 11.7% | 29.0% |
| Median | 10.7% | 17.1% |
| Interquartile 25% (IQ1) | 7.0% | 14.3% |
| Interquartile 75% (IQ3) | 13.8% | 32.4% |
| Interquartile Range (IQR) | 6.8% | 18.0% |
| Standard Deviation (Sample) | 7.1% | 24.4% |
| Standard Deviation (Population) | 7.0% | 23.9% |
Similar Demographics by Female Poverty
Demographics Similar to Estonians by Female Poverty
In terms of female poverty, the demographic groups most similar to Estonians are Immigrants from Serbia (12.1%, a difference of 0.060%), Scandinavian (12.1%, a difference of 0.14%), Immigrants from Europe (12.1%, a difference of 0.15%), Immigrants from Sri Lanka (12.1%, a difference of 0.25%), and Immigrants from Australia (12.2%, a difference of 0.39%).
| Demographics | Rating | Rank | Female Poverty |
| Immigrants | Romania | 99.0 /100 | #49 | Exceptional 12.0% |
| Slovenes | 98.9 /100 | #50 | Exceptional 12.0% |
| Immigrants | Bulgaria | 98.9 /100 | #51 | Exceptional 12.0% |
| Immigrants | Croatia | 98.7 /100 | #52 | Exceptional 12.0% |
| Immigrants | Austria | 98.7 /100 | #53 | Exceptional 12.0% |
| Immigrants | Philippines | 98.7 /100 | #54 | Exceptional 12.1% |
| Immigrants | Sri Lanka | 98.5 /100 | #55 | Exceptional 12.1% |
| Estonians | 98.3 /100 | #56 | Exceptional 12.1% |
| Immigrants | Serbia | 98.3 /100 | #57 | Exceptional 12.1% |
| Scandinavians | 98.2 /100 | #58 | Exceptional 12.1% |
| Immigrants | Europe | 98.2 /100 | #59 | Exceptional 12.1% |
| Immigrants | Australia | 98.1 /100 | #60 | Exceptional 12.2% |
| Immigrants | Asia | 98.1 /100 | #61 | Exceptional 12.2% |
| Immigrants | Italy | 98.0 /100 | #62 | Exceptional 12.2% |
| Ukrainians | 98.0 /100 | #63 | Exceptional 12.2% |
Demographics Similar to Immigrants from Cambodia by Female Poverty
In terms of female poverty, the demographic groups most similar to Immigrants from Cambodia are Nonimmigrants (14.5%, a difference of 0.020%), Alsatian (14.5%, a difference of 0.19%), Japanese (14.5%, a difference of 0.24%), Immigrants from Africa (14.5%, a difference of 0.26%), and Immigrants from Uzbekistan (14.4%, a difference of 0.38%).
| Demographics | Rating | Rank | Female Poverty |
| Marshallese | 5.0 /100 | #214 | Tragic 14.4% |
| Immigrants | Panama | 4.7 /100 | #215 | Tragic 14.4% |
| Immigrants | Thailand | 4.5 /100 | #216 | Tragic 14.4% |
| Immigrants | Immigrants | 4.5 /100 | #217 | Tragic 14.4% |
| Immigrants | Uzbekistan | 4.4 /100 | #218 | Tragic 14.4% |
| Japanese | 4.1 /100 | #219 | Tragic 14.5% |
| Alsatians | 4.0 /100 | #220 | Tragic 14.5% |
| Immigrants | Cambodia | 3.7 /100 | #221 | Tragic 14.5% |
| Immigrants | Nonimmigrants | 3.7 /100 | #222 | Tragic 14.5% |
| Immigrants | Africa | 3.3 /100 | #223 | Tragic 14.5% |
| Americans | 2.8 /100 | #224 | Tragic 14.6% |
| Immigrants | Micronesia | 2.8 /100 | #225 | Tragic 14.6% |
| Immigrants | Eritrea | 2.4 /100 | #226 | Tragic 14.6% |
| Immigrants | Nigeria | 2.1 /100 | #227 | Tragic 14.7% |
| German Russians | 2.0 /100 | #228 | Tragic 14.7% |