Immigrants from Panama vs Immigrants from West Indies Child Poverty Under the Age of 5
COMPARE
Immigrants from Panama
Immigrants from West Indies
Child Poverty Under the Age of 5
Child Poverty Under the Age of 5 Comparison
Immigrants from Panama
Immigrants from West Indies
18.5%
CHILD POVERTY UNDER THE AGE OF 5
6.0/ 100
METRIC RATING
215th/ 347
METRIC RANK
20.7%
CHILD POVERTY UNDER THE AGE OF 5
0.0/ 100
METRIC RATING
277th/ 347
METRIC RANK
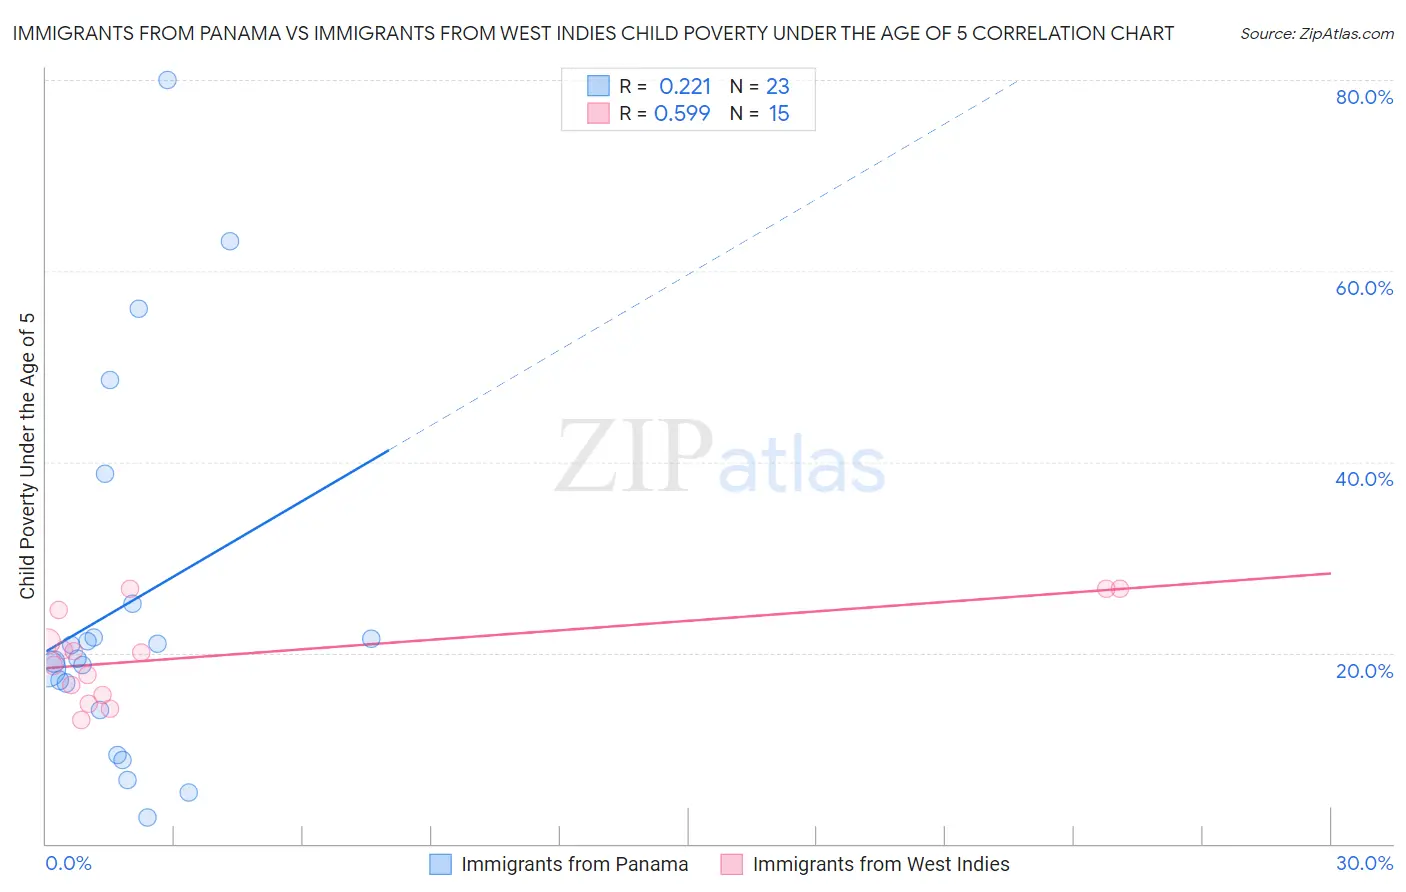
Immigrants from Panama vs Immigrants from West Indies Child Poverty Under the Age of 5 Correlation Chart
The statistical analysis conducted on geographies consisting of 217,169,883 people shows a weak positive correlation between the proportion of Immigrants from Panama and poverty level among children under the age of 5 in the United States with a correlation coefficient (R) of 0.221 and weighted average of 18.5%. Similarly, the statistical analysis conducted on geographies consisting of 71,916,924 people shows a substantial positive correlation between the proportion of Immigrants from West Indies and poverty level among children under the age of 5 in the United States with a correlation coefficient (R) of 0.599 and weighted average of 20.7%, a difference of 12.0%.
Child Poverty Under the Age of 5 Correlation Summary
| Measurement | Immigrants from Panama | Immigrants from West Indies |
| Minimum | 2.7% | 12.9% |
| Maximum | 80.0% | 26.7% |
| Range | 77.3% | 13.8% |
| Mean | 25.0% | 19.8% |
| Median | 19.4% | 20.0% |
| Interquartile 25% (IQ1) | 14.0% | 15.5% |
| Interquartile 75% (IQ3) | 25.1% | 24.5% |
| Interquartile Range (IQR) | 11.1% | 8.9% |
| Standard Deviation (Sample) | 19.5% | 4.7% |
| Standard Deviation (Population) | 19.1% | 4.5% |
Similar Demographics by Child Poverty Under the Age of 5
Demographics Similar to Immigrants from Panama by Child Poverty Under the Age of 5
In terms of child poverty under the age of 5, the demographic groups most similar to Immigrants from Panama are Malaysian (18.4%, a difference of 0.20%), Hmong (18.5%, a difference of 0.46%), Immigrants from Africa (18.6%, a difference of 0.66%), Immigrants from Thailand (18.3%, a difference of 0.97%), and Nepalese (18.3%, a difference of 0.99%).
| Demographics | Rating | Rank | Child Poverty Under the Age of 5 |
| Scotch-Irish | 9.8 /100 | #208 | Tragic 18.2% |
| Spanish | 9.8 /100 | #209 | Tragic 18.2% |
| Panamanians | 9.7 /100 | #210 | Tragic 18.2% |
| Moroccans | 9.4 /100 | #211 | Tragic 18.2% |
| Nepalese | 8.7 /100 | #212 | Tragic 18.3% |
| Immigrants | Thailand | 8.6 /100 | #213 | Tragic 18.3% |
| Malaysians | 6.5 /100 | #214 | Tragic 18.4% |
| Immigrants | Panama | 6.0 /100 | #215 | Tragic 18.5% |
| Hmong | 5.0 /100 | #216 | Tragic 18.5% |
| Immigrants | Africa | 4.6 /100 | #217 | Tragic 18.6% |
| Delaware | 3.4 /100 | #218 | Tragic 18.7% |
| German Russians | 3.0 /100 | #219 | Tragic 18.8% |
| Immigrants | Azores | 2.6 /100 | #220 | Tragic 18.9% |
| Immigrants | Nigeria | 2.1 /100 | #221 | Tragic 19.0% |
| Alsatians | 1.7 /100 | #222 | Tragic 19.1% |
Demographics Similar to Immigrants from West Indies by Child Poverty Under the Age of 5
In terms of child poverty under the age of 5, the demographic groups most similar to Immigrants from West Indies are Immigrants from Grenada (20.7%, a difference of 0.020%), West Indian (20.6%, a difference of 0.17%), Bangladeshi (20.6%, a difference of 0.26%), Immigrants from Belize (20.6%, a difference of 0.31%), and Subsaharan African (20.8%, a difference of 0.39%).
| Demographics | Rating | Rank | Child Poverty Under the Age of 5 |
| Jamaicans | 0.1 /100 | #270 | Tragic 20.4% |
| Americans | 0.1 /100 | #271 | Tragic 20.5% |
| Immigrants | Jamaica | 0.1 /100 | #272 | Tragic 20.5% |
| Central Americans | 0.1 /100 | #273 | Tragic 20.6% |
| Immigrants | Belize | 0.1 /100 | #274 | Tragic 20.6% |
| Bangladeshis | 0.1 /100 | #275 | Tragic 20.6% |
| West Indians | 0.0 /100 | #276 | Tragic 20.6% |
| Immigrants | West Indies | 0.0 /100 | #277 | Tragic 20.7% |
| Immigrants | Grenada | 0.0 /100 | #278 | Tragic 20.7% |
| Sub-Saharan Africans | 0.0 /100 | #279 | Tragic 20.8% |
| French American Indians | 0.0 /100 | #280 | Tragic 20.8% |
| Senegalese | 0.0 /100 | #281 | Tragic 20.9% |
| Potawatomi | 0.0 /100 | #282 | Tragic 21.0% |
| Comanche | 0.0 /100 | #283 | Tragic 21.0% |
| Somalis | 0.0 /100 | #284 | Tragic 21.1% |