Immigrants from Portugal vs Immigrants from West Indies Child Poverty Under the Age of 5
COMPARE
Immigrants from Portugal
Immigrants from West Indies
Child Poverty Under the Age of 5
Child Poverty Under the Age of 5 Comparison
Immigrants from Portugal
Immigrants from West Indies
17.8%
CHILD POVERTY UNDER THE AGE OF 5
22.2/ 100
METRIC RATING
196th/ 347
METRIC RANK
20.7%
CHILD POVERTY UNDER THE AGE OF 5
0.0/ 100
METRIC RATING
277th/ 347
METRIC RANK
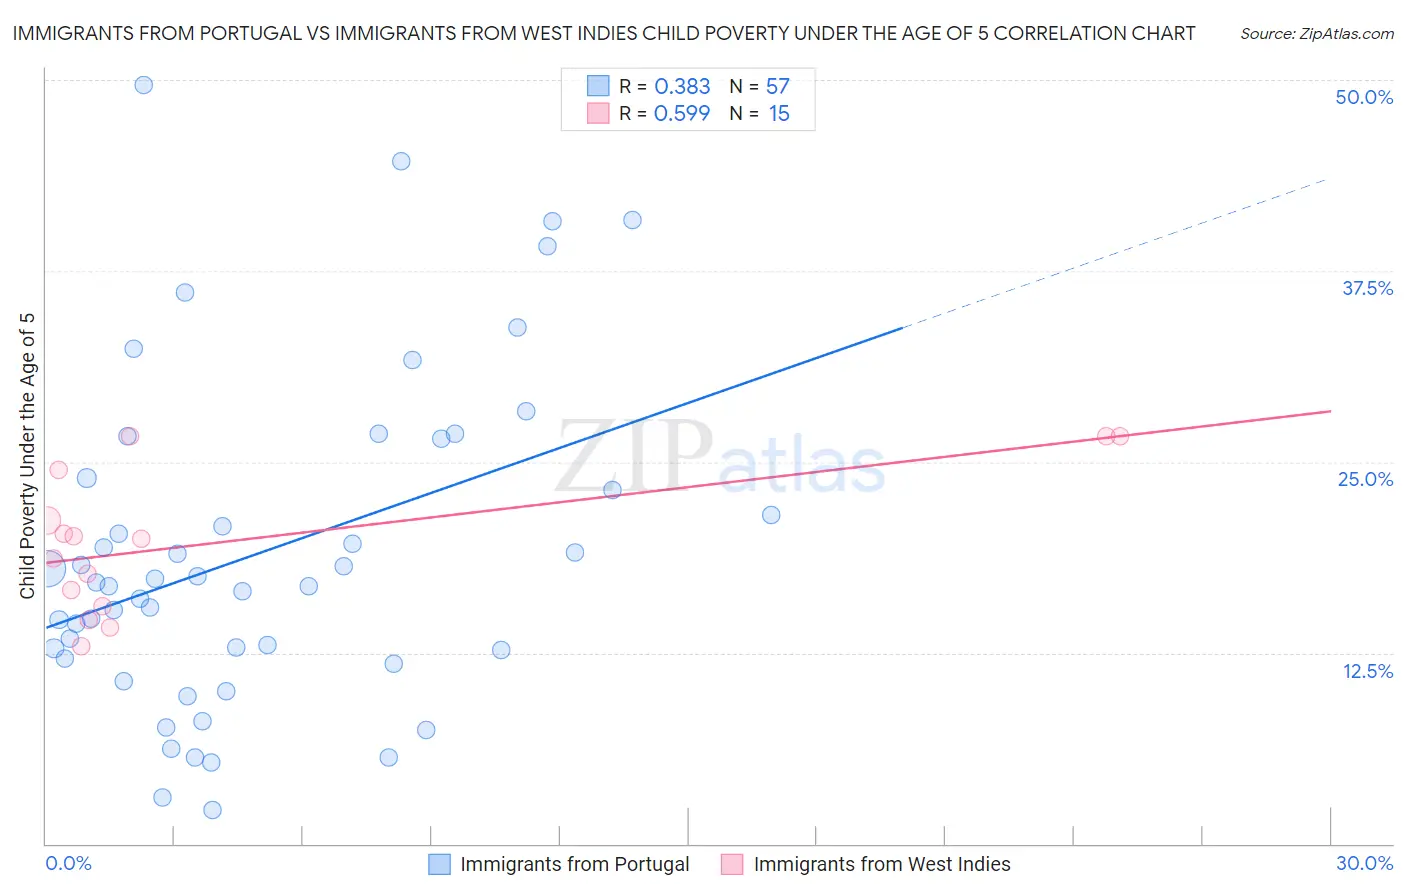
Immigrants from Portugal vs Immigrants from West Indies Child Poverty Under the Age of 5 Correlation Chart
The statistical analysis conducted on geographies consisting of 168,608,653 people shows a mild positive correlation between the proportion of Immigrants from Portugal and poverty level among children under the age of 5 in the United States with a correlation coefficient (R) of 0.383 and weighted average of 17.8%. Similarly, the statistical analysis conducted on geographies consisting of 71,916,924 people shows a substantial positive correlation between the proportion of Immigrants from West Indies and poverty level among children under the age of 5 in the United States with a correlation coefficient (R) of 0.599 and weighted average of 20.7%, a difference of 16.2%.
Child Poverty Under the Age of 5 Correlation Summary
| Measurement | Immigrants from Portugal | Immigrants from West Indies |
| Minimum | 2.2% | 12.9% |
| Maximum | 49.6% | 26.7% |
| Range | 47.4% | 13.8% |
| Mean | 19.1% | 19.8% |
| Median | 17.1% | 20.0% |
| Interquartile 25% (IQ1) | 12.4% | 15.5% |
| Interquartile 75% (IQ3) | 25.2% | 24.5% |
| Interquartile Range (IQR) | 12.8% | 8.9% |
| Standard Deviation (Sample) | 10.7% | 4.7% |
| Standard Deviation (Population) | 10.6% | 4.5% |
Similar Demographics by Child Poverty Under the Age of 5
Demographics Similar to Immigrants from Portugal by Child Poverty Under the Age of 5
In terms of child poverty under the age of 5, the demographic groups most similar to Immigrants from Portugal are Sierra Leonean (17.7%, a difference of 0.27%), Immigrants from Kenya (17.9%, a difference of 0.33%), French Canadian (17.7%, a difference of 0.34%), Immigrants from Uganda (17.7%, a difference of 0.39%), and Celtic (17.9%, a difference of 0.60%).
| Demographics | Rating | Rank | Child Poverty Under the Age of 5 |
| French | 33.6 /100 | #189 | Fair 17.5% |
| Slovaks | 29.2 /100 | #190 | Fair 17.6% |
| Immigrants | Afghanistan | 27.9 /100 | #191 | Fair 17.7% |
| Immigrants | Uruguay | 27.8 /100 | #192 | Fair 17.7% |
| Immigrants | Uganda | 25.0 /100 | #193 | Fair 17.7% |
| French Canadians | 24.6 /100 | #194 | Fair 17.7% |
| Sierra Leoneans | 24.1 /100 | #195 | Fair 17.7% |
| Immigrants | Portugal | 22.2 /100 | #196 | Fair 17.8% |
| Immigrants | Kenya | 20.0 /100 | #197 | Fair 17.9% |
| Celtics | 18.3 /100 | #198 | Poor 17.9% |
| Hungarians | 18.3 /100 | #199 | Poor 17.9% |
| Iraqis | 14.0 /100 | #200 | Poor 18.0% |
| Ugandans | 13.9 /100 | #201 | Poor 18.0% |
| Japanese | 13.8 /100 | #202 | Poor 18.1% |
| Immigrants | Cambodia | 13.7 /100 | #203 | Poor 18.1% |
Demographics Similar to Immigrants from West Indies by Child Poverty Under the Age of 5
In terms of child poverty under the age of 5, the demographic groups most similar to Immigrants from West Indies are Immigrants from Grenada (20.7%, a difference of 0.020%), West Indian (20.6%, a difference of 0.17%), Bangladeshi (20.6%, a difference of 0.26%), Immigrants from Belize (20.6%, a difference of 0.31%), and Subsaharan African (20.8%, a difference of 0.39%).
| Demographics | Rating | Rank | Child Poverty Under the Age of 5 |
| Jamaicans | 0.1 /100 | #270 | Tragic 20.4% |
| Americans | 0.1 /100 | #271 | Tragic 20.5% |
| Immigrants | Jamaica | 0.1 /100 | #272 | Tragic 20.5% |
| Central Americans | 0.1 /100 | #273 | Tragic 20.6% |
| Immigrants | Belize | 0.1 /100 | #274 | Tragic 20.6% |
| Bangladeshis | 0.1 /100 | #275 | Tragic 20.6% |
| West Indians | 0.0 /100 | #276 | Tragic 20.6% |
| Immigrants | West Indies | 0.0 /100 | #277 | Tragic 20.7% |
| Immigrants | Grenada | 0.0 /100 | #278 | Tragic 20.7% |
| Sub-Saharan Africans | 0.0 /100 | #279 | Tragic 20.8% |
| French American Indians | 0.0 /100 | #280 | Tragic 20.8% |
| Senegalese | 0.0 /100 | #281 | Tragic 20.9% |
| Potawatomi | 0.0 /100 | #282 | Tragic 21.0% |
| Comanche | 0.0 /100 | #283 | Tragic 21.0% |
| Somalis | 0.0 /100 | #284 | Tragic 21.1% |