New Zealander vs Immigrants from West Indies Child Poverty Under the Age of 5
COMPARE
New Zealander
Immigrants from West Indies
Child Poverty Under the Age of 5
Child Poverty Under the Age of 5 Comparison
New Zealanders
Immigrants from West Indies
16.6%
CHILD POVERTY UNDER THE AGE OF 5
78.7/ 100
METRIC RATING
149th/ 347
METRIC RANK
20.7%
CHILD POVERTY UNDER THE AGE OF 5
0.0/ 100
METRIC RATING
277th/ 347
METRIC RANK
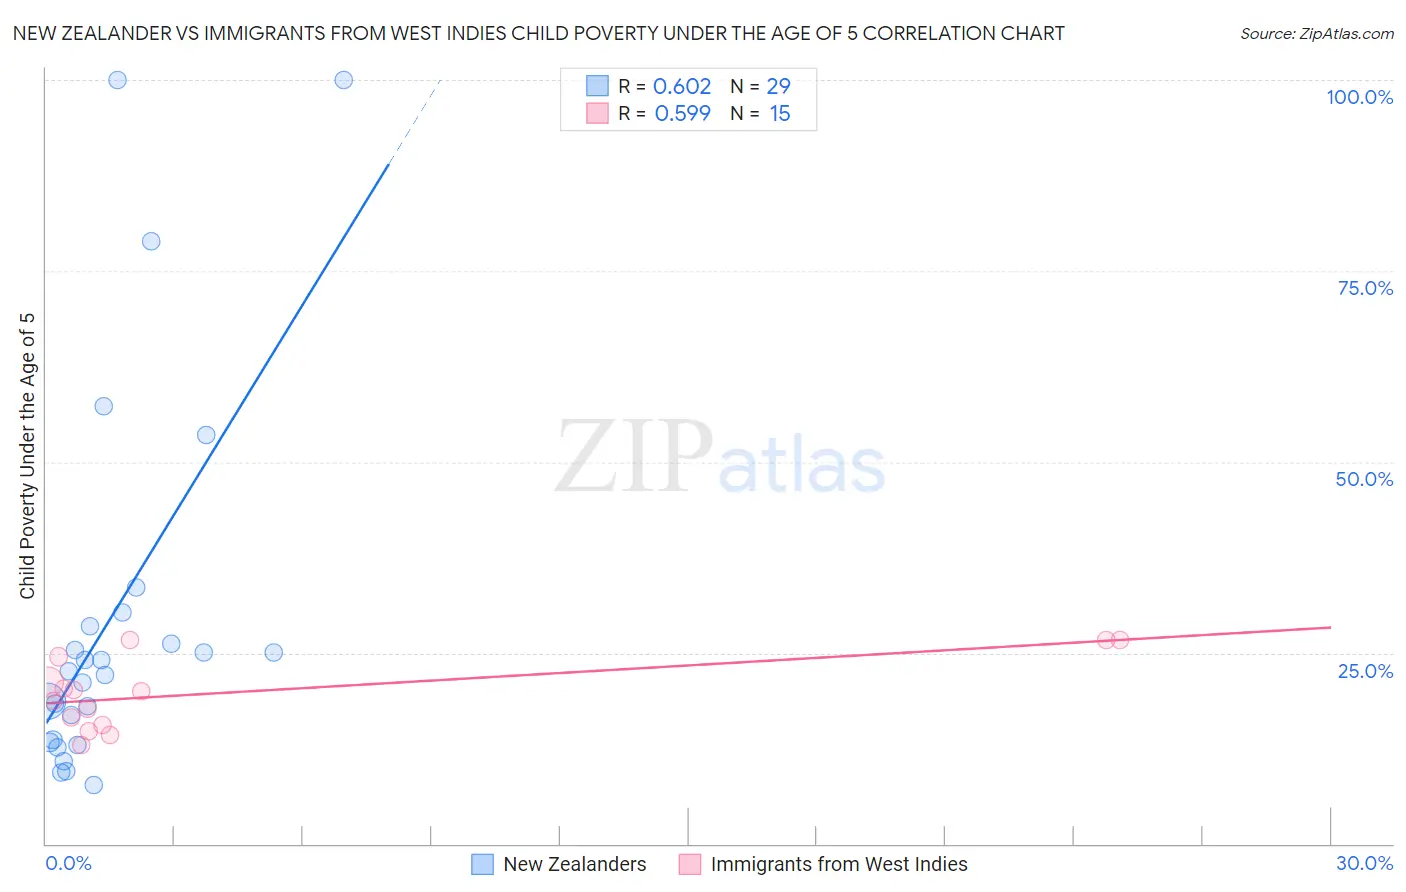
New Zealander vs Immigrants from West Indies Child Poverty Under the Age of 5 Correlation Chart
The statistical analysis conducted on geographies consisting of 105,110,769 people shows a significant positive correlation between the proportion of New Zealanders and poverty level among children under the age of 5 in the United States with a correlation coefficient (R) of 0.602 and weighted average of 16.6%. Similarly, the statistical analysis conducted on geographies consisting of 71,916,924 people shows a substantial positive correlation between the proportion of Immigrants from West Indies and poverty level among children under the age of 5 in the United States with a correlation coefficient (R) of 0.599 and weighted average of 20.7%, a difference of 24.2%.
Child Poverty Under the Age of 5 Correlation Summary
| Measurement | New Zealander | Immigrants from West Indies |
| Minimum | 7.7% | 12.9% |
| Maximum | 100.0% | 26.7% |
| Range | 92.3% | 13.8% |
| Mean | 29.6% | 19.8% |
| Median | 22.7% | 20.0% |
| Interquartile 25% (IQ1) | 13.4% | 15.5% |
| Interquartile 75% (IQ3) | 29.4% | 24.5% |
| Interquartile Range (IQR) | 16.0% | 8.9% |
| Standard Deviation (Sample) | 24.8% | 4.7% |
| Standard Deviation (Population) | 24.4% | 4.5% |
Similar Demographics by Child Poverty Under the Age of 5
Demographics Similar to New Zealanders by Child Poverty Under the Age of 5
In terms of child poverty under the age of 5, the demographic groups most similar to New Zealanders are Syrian (16.6%, a difference of 0.060%), Colombian (16.7%, a difference of 0.14%), Canadian (16.7%, a difference of 0.17%), Belgian (16.7%, a difference of 0.24%), and Immigrants from Nepal (16.6%, a difference of 0.25%).
| Demographics | Rating | Rank | Child Poverty Under the Age of 5 |
| Portuguese | 83.0 /100 | #142 | Excellent 16.5% |
| Samoans | 83.0 /100 | #143 | Excellent 16.5% |
| Ethiopians | 82.7 /100 | #144 | Excellent 16.5% |
| Immigrants | Ethiopia | 82.1 /100 | #145 | Excellent 16.6% |
| Israelis | 82.0 /100 | #146 | Excellent 16.6% |
| Immigrants | Nepal | 80.3 /100 | #147 | Excellent 16.6% |
| Syrians | 79.1 /100 | #148 | Good 16.6% |
| New Zealanders | 78.7 /100 | #149 | Good 16.6% |
| Colombians | 77.8 /100 | #150 | Good 16.7% |
| Canadians | 77.6 /100 | #151 | Good 16.7% |
| Belgians | 77.2 /100 | #152 | Good 16.7% |
| Dutch | 77.1 /100 | #153 | Good 16.7% |
| Immigrants | Venezuela | 76.0 /100 | #154 | Good 16.7% |
| South Americans | 75.1 /100 | #155 | Good 16.7% |
| Afghans | 74.4 /100 | #156 | Good 16.8% |
Demographics Similar to Immigrants from West Indies by Child Poverty Under the Age of 5
In terms of child poverty under the age of 5, the demographic groups most similar to Immigrants from West Indies are Immigrants from Grenada (20.7%, a difference of 0.020%), West Indian (20.6%, a difference of 0.17%), Bangladeshi (20.6%, a difference of 0.26%), Immigrants from Belize (20.6%, a difference of 0.31%), and Subsaharan African (20.8%, a difference of 0.39%).
| Demographics | Rating | Rank | Child Poverty Under the Age of 5 |
| Jamaicans | 0.1 /100 | #270 | Tragic 20.4% |
| Americans | 0.1 /100 | #271 | Tragic 20.5% |
| Immigrants | Jamaica | 0.1 /100 | #272 | Tragic 20.5% |
| Central Americans | 0.1 /100 | #273 | Tragic 20.6% |
| Immigrants | Belize | 0.1 /100 | #274 | Tragic 20.6% |
| Bangladeshis | 0.1 /100 | #275 | Tragic 20.6% |
| West Indians | 0.0 /100 | #276 | Tragic 20.6% |
| Immigrants | West Indies | 0.0 /100 | #277 | Tragic 20.7% |
| Immigrants | Grenada | 0.0 /100 | #278 | Tragic 20.7% |
| Sub-Saharan Africans | 0.0 /100 | #279 | Tragic 20.8% |
| French American Indians | 0.0 /100 | #280 | Tragic 20.8% |
| Senegalese | 0.0 /100 | #281 | Tragic 20.9% |
| Potawatomi | 0.0 /100 | #282 | Tragic 21.0% |
| Comanche | 0.0 /100 | #283 | Tragic 21.0% |
| Somalis | 0.0 /100 | #284 | Tragic 21.1% |