Immigrants from Panama vs New Zealander Child Poverty Under the Age of 5
COMPARE
Immigrants from Panama
New Zealander
Child Poverty Under the Age of 5
Child Poverty Under the Age of 5 Comparison
Immigrants from Panama
New Zealanders
18.5%
CHILD POVERTY UNDER THE AGE OF 5
6.0/ 100
METRIC RATING
215th/ 347
METRIC RANK
16.6%
CHILD POVERTY UNDER THE AGE OF 5
78.7/ 100
METRIC RATING
149th/ 347
METRIC RANK
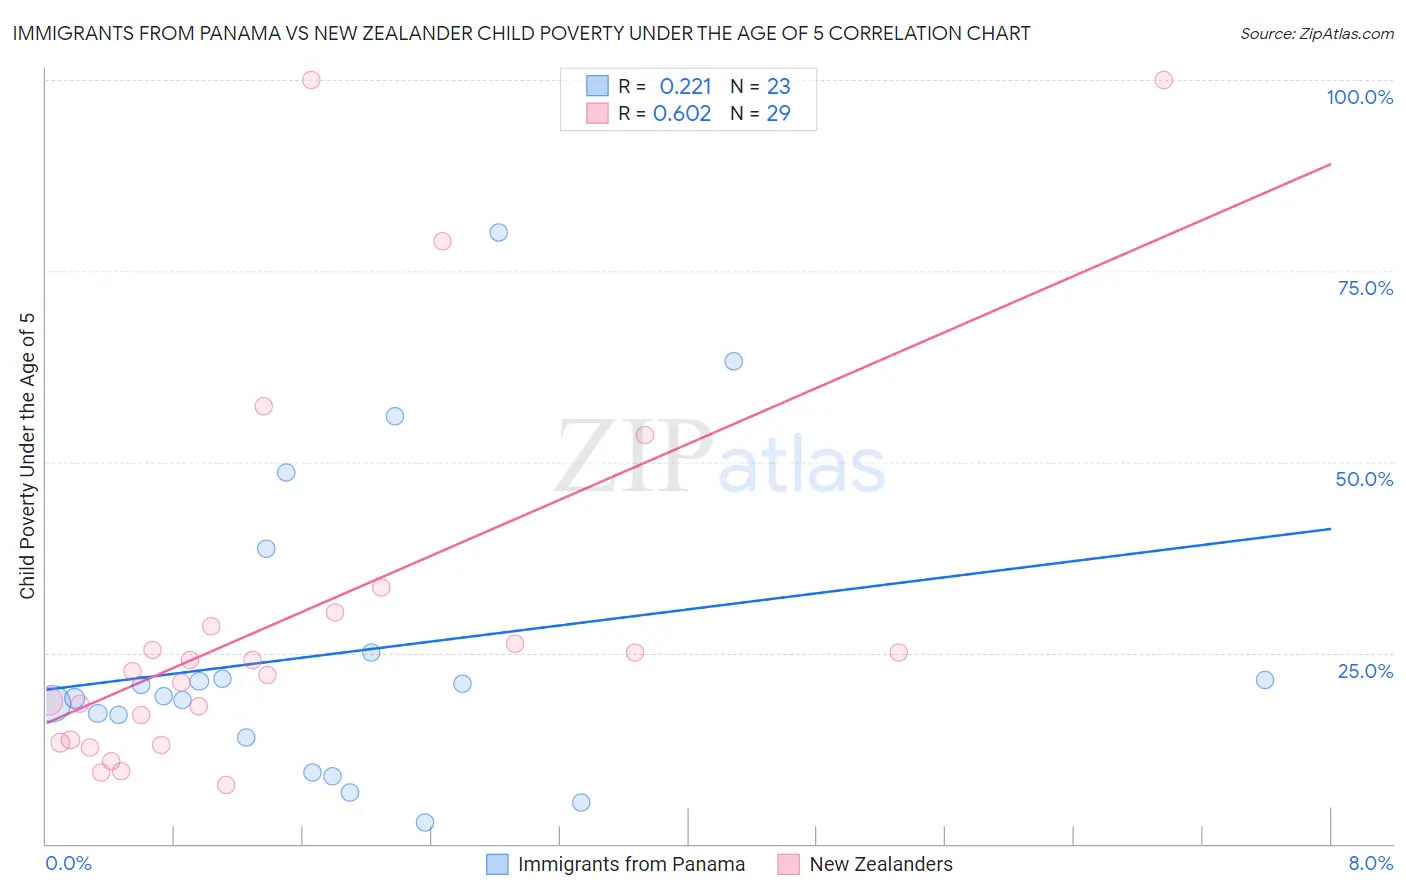
Immigrants from Panama vs New Zealander Child Poverty Under the Age of 5 Correlation Chart
The statistical analysis conducted on geographies consisting of 217,169,883 people shows a weak positive correlation between the proportion of Immigrants from Panama and poverty level among children under the age of 5 in the United States with a correlation coefficient (R) of 0.221 and weighted average of 18.5%. Similarly, the statistical analysis conducted on geographies consisting of 105,110,769 people shows a significant positive correlation between the proportion of New Zealanders and poverty level among children under the age of 5 in the United States with a correlation coefficient (R) of 0.602 and weighted average of 16.6%, a difference of 10.9%.
Child Poverty Under the Age of 5 Correlation Summary
| Measurement | Immigrants from Panama | New Zealander |
| Minimum | 2.7% | 7.7% |
| Maximum | 80.0% | 100.0% |
| Range | 77.3% | 92.3% |
| Mean | 25.0% | 29.6% |
| Median | 19.4% | 22.7% |
| Interquartile 25% (IQ1) | 14.0% | 13.4% |
| Interquartile 75% (IQ3) | 25.1% | 29.4% |
| Interquartile Range (IQR) | 11.1% | 16.0% |
| Standard Deviation (Sample) | 19.5% | 24.8% |
| Standard Deviation (Population) | 19.1% | 24.4% |
Similar Demographics by Child Poverty Under the Age of 5
Demographics Similar to Immigrants from Panama by Child Poverty Under the Age of 5
In terms of child poverty under the age of 5, the demographic groups most similar to Immigrants from Panama are Malaysian (18.4%, a difference of 0.20%), Hmong (18.5%, a difference of 0.46%), Immigrants from Africa (18.6%, a difference of 0.66%), Immigrants from Thailand (18.3%, a difference of 0.97%), and Nepalese (18.3%, a difference of 0.99%).
| Demographics | Rating | Rank | Child Poverty Under the Age of 5 |
| Scotch-Irish | 9.8 /100 | #208 | Tragic 18.2% |
| Spanish | 9.8 /100 | #209 | Tragic 18.2% |
| Panamanians | 9.7 /100 | #210 | Tragic 18.2% |
| Moroccans | 9.4 /100 | #211 | Tragic 18.2% |
| Nepalese | 8.7 /100 | #212 | Tragic 18.3% |
| Immigrants | Thailand | 8.6 /100 | #213 | Tragic 18.3% |
| Malaysians | 6.5 /100 | #214 | Tragic 18.4% |
| Immigrants | Panama | 6.0 /100 | #215 | Tragic 18.5% |
| Hmong | 5.0 /100 | #216 | Tragic 18.5% |
| Immigrants | Africa | 4.6 /100 | #217 | Tragic 18.6% |
| Delaware | 3.4 /100 | #218 | Tragic 18.7% |
| German Russians | 3.0 /100 | #219 | Tragic 18.8% |
| Immigrants | Azores | 2.6 /100 | #220 | Tragic 18.9% |
| Immigrants | Nigeria | 2.1 /100 | #221 | Tragic 19.0% |
| Alsatians | 1.7 /100 | #222 | Tragic 19.1% |
Demographics Similar to New Zealanders by Child Poverty Under the Age of 5
In terms of child poverty under the age of 5, the demographic groups most similar to New Zealanders are Syrian (16.6%, a difference of 0.060%), Colombian (16.7%, a difference of 0.14%), Canadian (16.7%, a difference of 0.17%), Belgian (16.7%, a difference of 0.24%), and Immigrants from Nepal (16.6%, a difference of 0.25%).
| Demographics | Rating | Rank | Child Poverty Under the Age of 5 |
| Portuguese | 83.0 /100 | #142 | Excellent 16.5% |
| Samoans | 83.0 /100 | #143 | Excellent 16.5% |
| Ethiopians | 82.7 /100 | #144 | Excellent 16.5% |
| Immigrants | Ethiopia | 82.1 /100 | #145 | Excellent 16.6% |
| Israelis | 82.0 /100 | #146 | Excellent 16.6% |
| Immigrants | Nepal | 80.3 /100 | #147 | Excellent 16.6% |
| Syrians | 79.1 /100 | #148 | Good 16.6% |
| New Zealanders | 78.7 /100 | #149 | Good 16.6% |
| Colombians | 77.8 /100 | #150 | Good 16.7% |
| Canadians | 77.6 /100 | #151 | Good 16.7% |
| Belgians | 77.2 /100 | #152 | Good 16.7% |
| Dutch | 77.1 /100 | #153 | Good 16.7% |
| Immigrants | Venezuela | 76.0 /100 | #154 | Good 16.7% |
| South Americans | 75.1 /100 | #155 | Good 16.7% |
| Afghans | 74.4 /100 | #156 | Good 16.8% |