Czech vs Immigrants from West Indies Child Poverty Under the Age of 5
COMPARE
Czech
Immigrants from West Indies
Child Poverty Under the Age of 5
Child Poverty Under the Age of 5 Comparison
Czechs
Immigrants from West Indies
15.5%
CHILD POVERTY UNDER THE AGE OF 5
97.8/ 100
METRIC RATING
81st/ 347
METRIC RANK
20.7%
CHILD POVERTY UNDER THE AGE OF 5
0.0/ 100
METRIC RATING
277th/ 347
METRIC RANK
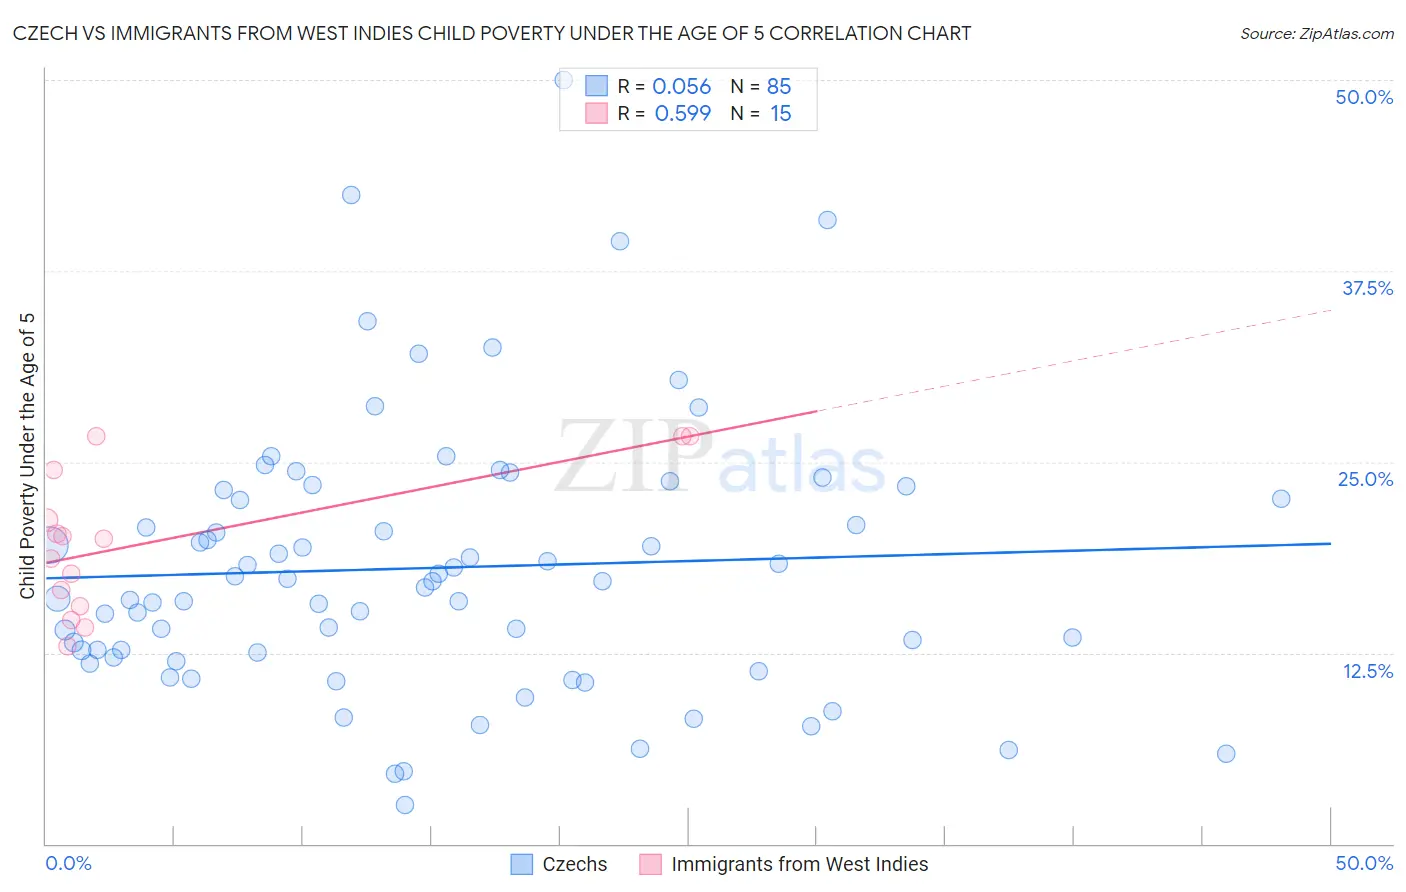
Czech vs Immigrants from West Indies Child Poverty Under the Age of 5 Correlation Chart
The statistical analysis conducted on geographies consisting of 456,271,620 people shows a slight positive correlation between the proportion of Czechs and poverty level among children under the age of 5 in the United States with a correlation coefficient (R) of 0.056 and weighted average of 15.5%. Similarly, the statistical analysis conducted on geographies consisting of 71,916,924 people shows a substantial positive correlation between the proportion of Immigrants from West Indies and poverty level among children under the age of 5 in the United States with a correlation coefficient (R) of 0.599 and weighted average of 20.7%, a difference of 33.1%.
Child Poverty Under the Age of 5 Correlation Summary
| Measurement | Czech | Immigrants from West Indies |
| Minimum | 2.6% | 12.9% |
| Maximum | 50.0% | 26.7% |
| Range | 47.4% | 13.8% |
| Mean | 18.1% | 19.8% |
| Median | 17.2% | 20.0% |
| Interquartile 25% (IQ1) | 12.3% | 15.5% |
| Interquartile 75% (IQ3) | 22.9% | 24.5% |
| Interquartile Range (IQR) | 10.5% | 8.9% |
| Standard Deviation (Sample) | 8.8% | 4.7% |
| Standard Deviation (Population) | 8.7% | 4.5% |
Similar Demographics by Child Poverty Under the Age of 5
Demographics Similar to Czechs by Child Poverty Under the Age of 5
In terms of child poverty under the age of 5, the demographic groups most similar to Czechs are Italian (15.5%, a difference of 0.11%), Immigrants from Italy (15.6%, a difference of 0.14%), Australian (15.5%, a difference of 0.23%), Chilean (15.6%, a difference of 0.30%), and Immigrants from Netherlands (15.6%, a difference of 0.32%).
| Demographics | Rating | Rank | Child Poverty Under the Age of 5 |
| Argentineans | 98.5 /100 | #74 | Exceptional 15.4% |
| Immigrants | Argentina | 98.5 /100 | #75 | Exceptional 15.4% |
| Croatians | 98.5 /100 | #76 | Exceptional 15.4% |
| Immigrants | Turkey | 98.3 /100 | #77 | Exceptional 15.4% |
| Sri Lankans | 98.1 /100 | #78 | Exceptional 15.5% |
| Australians | 98.0 /100 | #79 | Exceptional 15.5% |
| Italians | 97.9 /100 | #80 | Exceptional 15.5% |
| Czechs | 97.8 /100 | #81 | Exceptional 15.5% |
| Immigrants | Italy | 97.7 /100 | #82 | Exceptional 15.6% |
| Chileans | 97.6 /100 | #83 | Exceptional 15.6% |
| Immigrants | Netherlands | 97.6 /100 | #84 | Exceptional 15.6% |
| Immigrants | Latvia | 97.4 /100 | #85 | Exceptional 15.6% |
| Immigrants | Malaysia | 97.4 /100 | #86 | Exceptional 15.6% |
| Immigrants | Vietnam | 97.4 /100 | #87 | Exceptional 15.6% |
| Jordanians | 97.3 /100 | #88 | Exceptional 15.6% |
Demographics Similar to Immigrants from West Indies by Child Poverty Under the Age of 5
In terms of child poverty under the age of 5, the demographic groups most similar to Immigrants from West Indies are Immigrants from Grenada (20.7%, a difference of 0.020%), West Indian (20.6%, a difference of 0.17%), Bangladeshi (20.6%, a difference of 0.26%), Immigrants from Belize (20.6%, a difference of 0.31%), and Subsaharan African (20.8%, a difference of 0.39%).
| Demographics | Rating | Rank | Child Poverty Under the Age of 5 |
| Jamaicans | 0.1 /100 | #270 | Tragic 20.4% |
| Americans | 0.1 /100 | #271 | Tragic 20.5% |
| Immigrants | Jamaica | 0.1 /100 | #272 | Tragic 20.5% |
| Central Americans | 0.1 /100 | #273 | Tragic 20.6% |
| Immigrants | Belize | 0.1 /100 | #274 | Tragic 20.6% |
| Bangladeshis | 0.1 /100 | #275 | Tragic 20.6% |
| West Indians | 0.0 /100 | #276 | Tragic 20.6% |
| Immigrants | West Indies | 0.0 /100 | #277 | Tragic 20.7% |
| Immigrants | Grenada | 0.0 /100 | #278 | Tragic 20.7% |
| Sub-Saharan Africans | 0.0 /100 | #279 | Tragic 20.8% |
| French American Indians | 0.0 /100 | #280 | Tragic 20.8% |
| Senegalese | 0.0 /100 | #281 | Tragic 20.9% |
| Potawatomi | 0.0 /100 | #282 | Tragic 21.0% |
| Comanche | 0.0 /100 | #283 | Tragic 21.0% |
| Somalis | 0.0 /100 | #284 | Tragic 21.1% |