Ecuadorian vs Immigrants from West Indies Child Poverty Under the Age of 5
COMPARE
Ecuadorian
Immigrants from West Indies
Child Poverty Under the Age of 5
Child Poverty Under the Age of 5 Comparison
Ecuadorians
Immigrants from West Indies
19.2%
CHILD POVERTY UNDER THE AGE OF 5
1.2/ 100
METRIC RATING
230th/ 347
METRIC RANK
20.7%
CHILD POVERTY UNDER THE AGE OF 5
0.0/ 100
METRIC RATING
277th/ 347
METRIC RANK
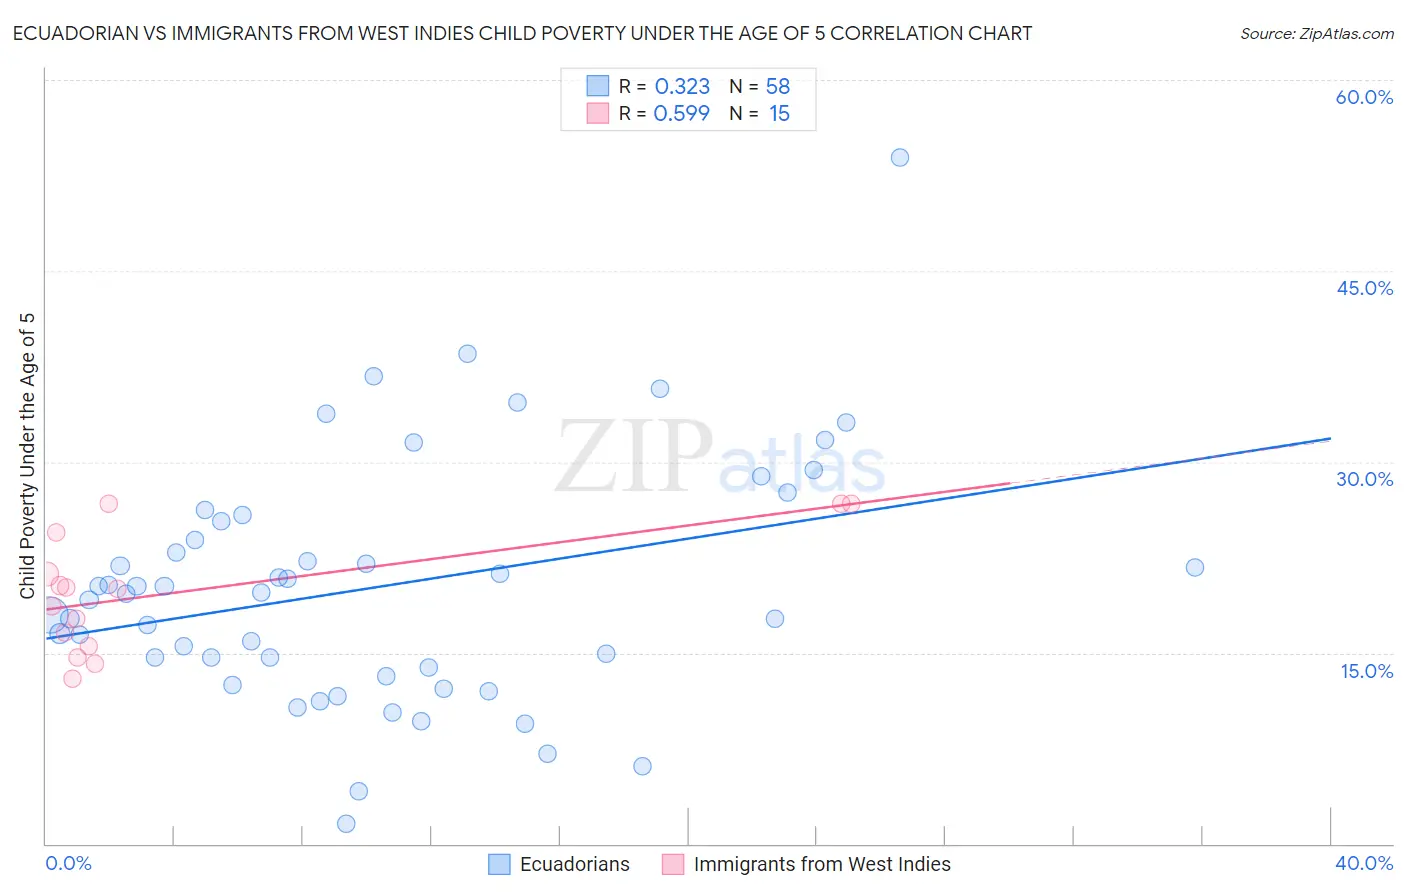
Ecuadorian vs Immigrants from West Indies Child Poverty Under the Age of 5 Correlation Chart
The statistical analysis conducted on geographies consisting of 306,907,692 people shows a mild positive correlation between the proportion of Ecuadorians and poverty level among children under the age of 5 in the United States with a correlation coefficient (R) of 0.323 and weighted average of 19.2%. Similarly, the statistical analysis conducted on geographies consisting of 71,916,924 people shows a substantial positive correlation between the proportion of Immigrants from West Indies and poverty level among children under the age of 5 in the United States with a correlation coefficient (R) of 0.599 and weighted average of 20.7%, a difference of 7.7%.
Child Poverty Under the Age of 5 Correlation Summary
| Measurement | Ecuadorian | Immigrants from West Indies |
| Minimum | 1.5% | 12.9% |
| Maximum | 53.9% | 26.7% |
| Range | 52.3% | 13.8% |
| Mean | 20.1% | 19.8% |
| Median | 19.7% | 20.0% |
| Interquartile 25% (IQ1) | 13.9% | 15.5% |
| Interquartile 75% (IQ3) | 25.4% | 24.5% |
| Interquartile Range (IQR) | 11.5% | 8.9% |
| Standard Deviation (Sample) | 9.5% | 4.7% |
| Standard Deviation (Population) | 9.5% | 4.5% |
Similar Demographics by Child Poverty Under the Age of 5
Demographics Similar to Ecuadorians by Child Poverty Under the Age of 5
In terms of child poverty under the age of 5, the demographic groups most similar to Ecuadorians are Ghanaian (19.2%, a difference of 0.040%), Bermudan (19.2%, a difference of 0.050%), Immigrants from Sudan (19.2%, a difference of 0.12%), Cape Verdean (19.1%, a difference of 0.43%), and Immigrants from Eritrea (19.1%, a difference of 0.61%).
| Demographics | Rating | Rank | Child Poverty Under the Age of 5 |
| Cubans | 1.7 /100 | #223 | Tragic 19.1% |
| Nicaraguans | 1.6 /100 | #224 | Tragic 19.1% |
| Nigerians | 1.6 /100 | #225 | Tragic 19.1% |
| Immigrants | Eritrea | 1.5 /100 | #226 | Tragic 19.1% |
| Cape Verdeans | 1.4 /100 | #227 | Tragic 19.1% |
| Immigrants | Sudan | 1.3 /100 | #228 | Tragic 19.2% |
| Ghanaians | 1.2 /100 | #229 | Tragic 19.2% |
| Ecuadorians | 1.2 /100 | #230 | Tragic 19.2% |
| Bermudans | 1.2 /100 | #231 | Tragic 19.2% |
| Trinidadians and Tobagonians | 0.9 /100 | #232 | Tragic 19.3% |
| Sudanese | 0.9 /100 | #233 | Tragic 19.3% |
| Immigrants | Micronesia | 0.9 /100 | #234 | Tragic 19.4% |
| Immigrants | Laos | 0.8 /100 | #235 | Tragic 19.4% |
| Immigrants | Trinidad and Tobago | 0.8 /100 | #236 | Tragic 19.4% |
| Immigrants | Cabo Verde | 0.6 /100 | #237 | Tragic 19.5% |
Demographics Similar to Immigrants from West Indies by Child Poverty Under the Age of 5
In terms of child poverty under the age of 5, the demographic groups most similar to Immigrants from West Indies are Immigrants from Grenada (20.7%, a difference of 0.020%), West Indian (20.6%, a difference of 0.17%), Bangladeshi (20.6%, a difference of 0.26%), Immigrants from Belize (20.6%, a difference of 0.31%), and Subsaharan African (20.8%, a difference of 0.39%).
| Demographics | Rating | Rank | Child Poverty Under the Age of 5 |
| Jamaicans | 0.1 /100 | #270 | Tragic 20.4% |
| Americans | 0.1 /100 | #271 | Tragic 20.5% |
| Immigrants | Jamaica | 0.1 /100 | #272 | Tragic 20.5% |
| Central Americans | 0.1 /100 | #273 | Tragic 20.6% |
| Immigrants | Belize | 0.1 /100 | #274 | Tragic 20.6% |
| Bangladeshis | 0.1 /100 | #275 | Tragic 20.6% |
| West Indians | 0.0 /100 | #276 | Tragic 20.6% |
| Immigrants | West Indies | 0.0 /100 | #277 | Tragic 20.7% |
| Immigrants | Grenada | 0.0 /100 | #278 | Tragic 20.7% |
| Sub-Saharan Africans | 0.0 /100 | #279 | Tragic 20.8% |
| French American Indians | 0.0 /100 | #280 | Tragic 20.8% |
| Senegalese | 0.0 /100 | #281 | Tragic 20.9% |
| Potawatomi | 0.0 /100 | #282 | Tragic 21.0% |
| Comanche | 0.0 /100 | #283 | Tragic 21.0% |
| Somalis | 0.0 /100 | #284 | Tragic 21.1% |