Barbadian vs Immigrants from West Indies Child Poverty Under the Age of 5
COMPARE
Barbadian
Immigrants from West Indies
Child Poverty Under the Age of 5
Child Poverty Under the Age of 5 Comparison
Barbadians
Immigrants from West Indies
20.2%
CHILD POVERTY UNDER THE AGE OF 5
0.1/ 100
METRIC RATING
263rd/ 347
METRIC RANK
20.7%
CHILD POVERTY UNDER THE AGE OF 5
0.0/ 100
METRIC RATING
277th/ 347
METRIC RANK
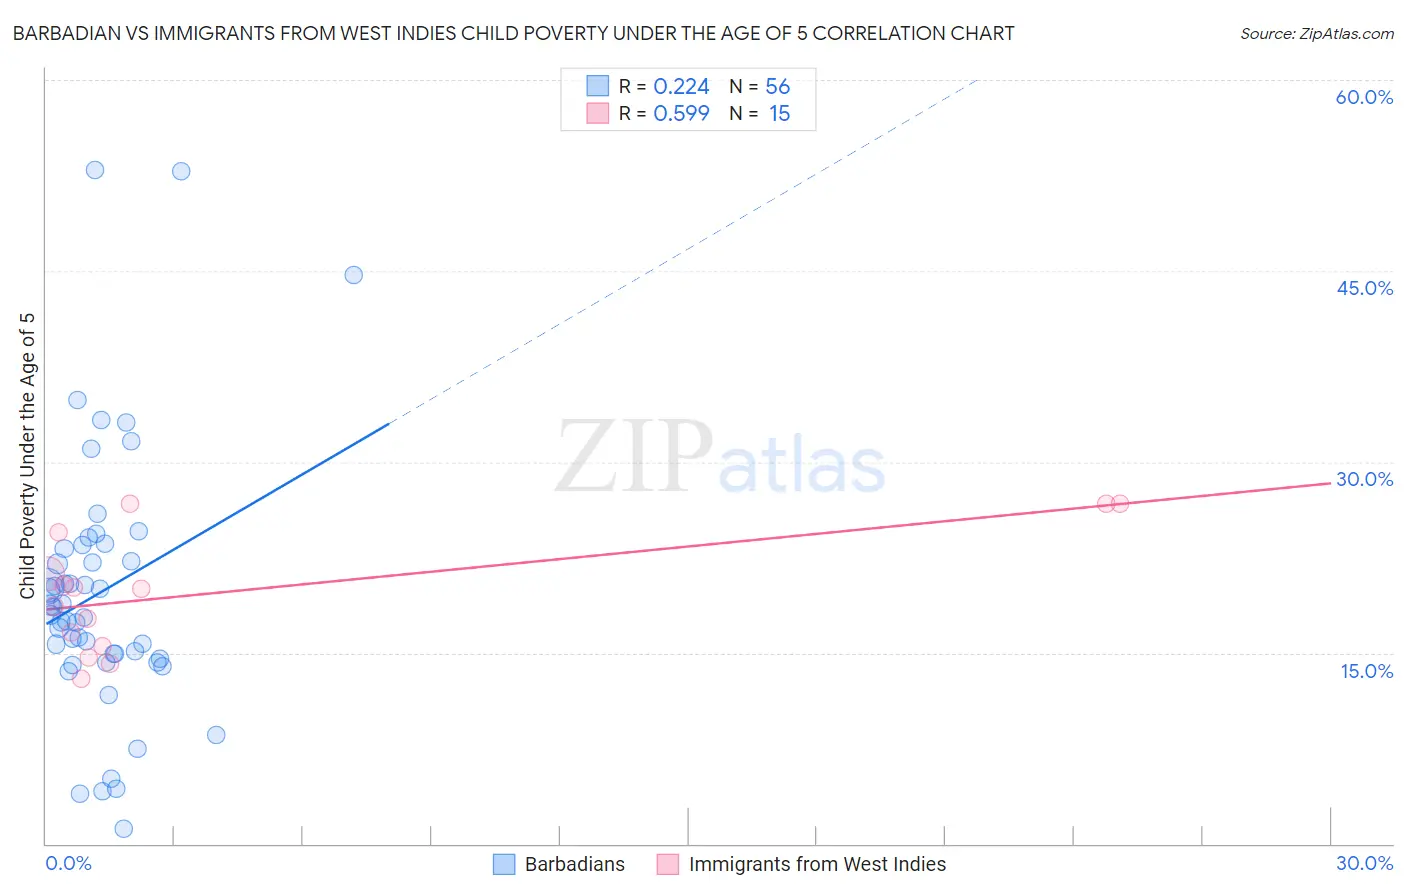
Barbadian vs Immigrants from West Indies Child Poverty Under the Age of 5 Correlation Chart
The statistical analysis conducted on geographies consisting of 139,162,616 people shows a weak positive correlation between the proportion of Barbadians and poverty level among children under the age of 5 in the United States with a correlation coefficient (R) of 0.224 and weighted average of 20.2%. Similarly, the statistical analysis conducted on geographies consisting of 71,916,924 people shows a substantial positive correlation between the proportion of Immigrants from West Indies and poverty level among children under the age of 5 in the United States with a correlation coefficient (R) of 0.599 and weighted average of 20.7%, a difference of 2.5%.
Child Poverty Under the Age of 5 Correlation Summary
| Measurement | Barbadian | Immigrants from West Indies |
| Minimum | 1.1% | 12.9% |
| Maximum | 52.9% | 26.7% |
| Range | 51.8% | 13.8% |
| Mean | 19.8% | 19.8% |
| Median | 18.3% | 20.0% |
| Interquartile 25% (IQ1) | 14.7% | 15.5% |
| Interquartile 75% (IQ3) | 23.3% | 24.5% |
| Interquartile Range (IQR) | 8.6% | 8.9% |
| Standard Deviation (Sample) | 10.3% | 4.7% |
| Standard Deviation (Population) | 10.2% | 4.5% |
Demographics Similar to Barbadians and Immigrants from West Indies by Child Poverty Under the Age of 5
In terms of child poverty under the age of 5, the demographic groups most similar to Barbadians are Liberian (20.2%, a difference of 0.070%), Immigrants from Liberia (20.2%, a difference of 0.12%), Spanish American Indian (20.2%, a difference of 0.24%), Aleut (20.3%, a difference of 0.37%), and Immigrants from Bangladesh (20.1%, a difference of 0.48%). Similarly, the demographic groups most similar to Immigrants from West Indies are Immigrants from Grenada (20.7%, a difference of 0.020%), West Indian (20.6%, a difference of 0.17%), Bangladeshi (20.6%, a difference of 0.26%), Immigrants from Belize (20.6%, a difference of 0.31%), and Subsaharan African (20.8%, a difference of 0.39%).
| Demographics | Rating | Rank | Child Poverty Under the Age of 5 |
| Spanish Americans | 0.2 /100 | #260 | Tragic 20.1% |
| Immigrants | Bangladesh | 0.2 /100 | #261 | Tragic 20.1% |
| Liberians | 0.1 /100 | #262 | Tragic 20.2% |
| Barbadians | 0.1 /100 | #263 | Tragic 20.2% |
| Immigrants | Liberia | 0.1 /100 | #264 | Tragic 20.2% |
| Spanish American Indians | 0.1 /100 | #265 | Tragic 20.2% |
| Aleuts | 0.1 /100 | #266 | Tragic 20.3% |
| Ottawa | 0.1 /100 | #267 | Tragic 20.3% |
| Belizeans | 0.1 /100 | #268 | Tragic 20.3% |
| Immigrants | Burma/Myanmar | 0.1 /100 | #269 | Tragic 20.4% |
| Jamaicans | 0.1 /100 | #270 | Tragic 20.4% |
| Americans | 0.1 /100 | #271 | Tragic 20.5% |
| Immigrants | Jamaica | 0.1 /100 | #272 | Tragic 20.5% |
| Central Americans | 0.1 /100 | #273 | Tragic 20.6% |
| Immigrants | Belize | 0.1 /100 | #274 | Tragic 20.6% |
| Bangladeshis | 0.1 /100 | #275 | Tragic 20.6% |
| West Indians | 0.0 /100 | #276 | Tragic 20.6% |
| Immigrants | West Indies | 0.0 /100 | #277 | Tragic 20.7% |
| Immigrants | Grenada | 0.0 /100 | #278 | Tragic 20.7% |
| Sub-Saharan Africans | 0.0 /100 | #279 | Tragic 20.8% |
| French American Indians | 0.0 /100 | #280 | Tragic 20.8% |