Immigrants from Pakistan vs French Canadian Married-Couple Family Poverty
COMPARE
Immigrants from Pakistan
French Canadian
Married-Couple Family Poverty
Married-Couple Family Poverty Comparison
Immigrants from Pakistan
French Canadians
4.9%
MARRIED-COUPLE FAMILY POVERTY
90.7/ 100
METRIC RATING
129th/ 347
METRIC RANK
4.2%
MARRIED-COUPLE FAMILY POVERTY
99.8/ 100
METRIC RATING
40th/ 347
METRIC RANK
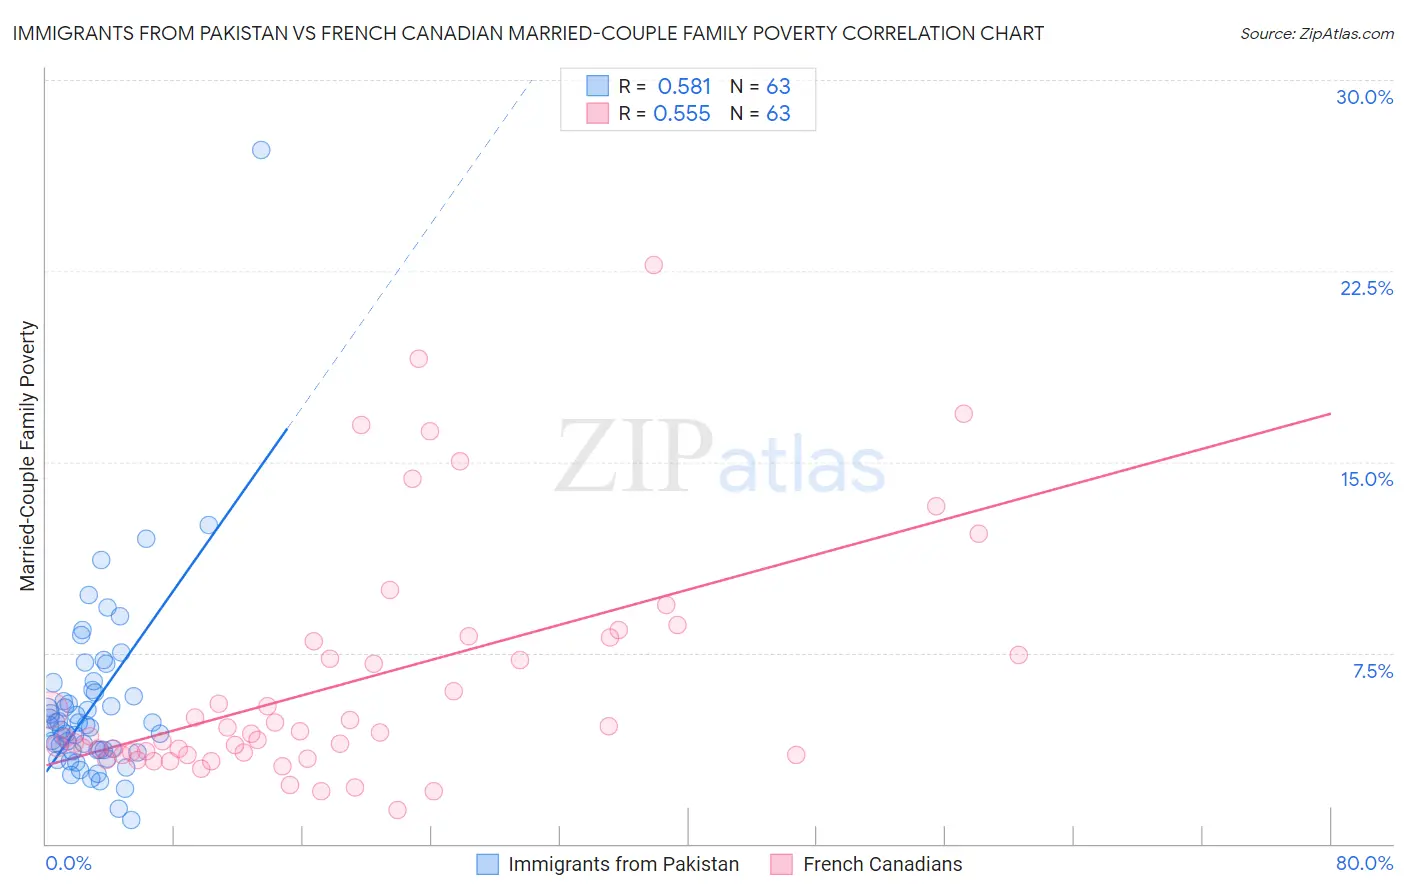
Immigrants from Pakistan vs French Canadian Married-Couple Family Poverty Correlation Chart
The statistical analysis conducted on geographies consisting of 282,275,406 people shows a substantial positive correlation between the proportion of Immigrants from Pakistan and poverty level among married-couple families in the United States with a correlation coefficient (R) of 0.581 and weighted average of 4.9%. Similarly, the statistical analysis conducted on geographies consisting of 493,719,375 people shows a substantial positive correlation between the proportion of French Canadians and poverty level among married-couple families in the United States with a correlation coefficient (R) of 0.555 and weighted average of 4.2%, a difference of 14.7%.
Married-Couple Family Poverty Correlation Summary
| Measurement | Immigrants from Pakistan | French Canadian |
| Minimum | 0.95% | 1.3% |
| Maximum | 27.3% | 22.7% |
| Range | 26.3% | 21.4% |
| Mean | 5.5% | 6.3% |
| Median | 4.7% | 4.3% |
| Interquartile 25% (IQ1) | 3.7% | 3.5% |
| Interquartile 75% (IQ3) | 6.0% | 8.0% |
| Interquartile Range (IQR) | 2.4% | 4.5% |
| Standard Deviation (Sample) | 3.7% | 4.6% |
| Standard Deviation (Population) | 3.6% | 4.6% |
Similar Demographics by Married-Couple Family Poverty
Demographics Similar to Immigrants from Pakistan by Married-Couple Family Poverty
In terms of married-couple family poverty, the demographic groups most similar to Immigrants from Pakistan are Soviet Union (4.9%, a difference of 0.010%), Immigrants from Eastern Europe (4.9%, a difference of 0.080%), Puget Sound Salish (4.9%, a difference of 0.090%), Immigrants from Kenya (4.9%, a difference of 0.16%), and Samoan (4.9%, a difference of 0.17%).
| Demographics | Rating | Rank | Married-Couple Family Poverty |
| Whites/Caucasians | 93.1 /100 | #122 | Exceptional 4.8% |
| Jordanians | 93.1 /100 | #123 | Exceptional 4.8% |
| Romanians | 92.5 /100 | #124 | Exceptional 4.8% |
| Immigrants | Bosnia and Herzegovina | 92.5 /100 | #125 | Exceptional 4.8% |
| Immigrants | Asia | 92.3 /100 | #126 | Exceptional 4.8% |
| Egyptians | 92.0 /100 | #127 | Exceptional 4.8% |
| Palestinians | 91.2 /100 | #128 | Exceptional 4.9% |
| Immigrants | Pakistan | 90.7 /100 | #129 | Exceptional 4.9% |
| Soviet Union | 90.7 /100 | #130 | Exceptional 4.9% |
| Immigrants | Eastern Europe | 90.5 /100 | #131 | Exceptional 4.9% |
| Puget Sound Salish | 90.4 /100 | #132 | Exceptional 4.9% |
| Immigrants | Kenya | 90.2 /100 | #133 | Exceptional 4.9% |
| Samoans | 90.2 /100 | #134 | Exceptional 4.9% |
| Assyrians/Chaldeans/Syriacs | 89.4 /100 | #135 | Excellent 4.9% |
| Immigrants | Hungary | 88.7 /100 | #136 | Excellent 4.9% |
Demographics Similar to French Canadians by Married-Couple Family Poverty
In terms of married-couple family poverty, the demographic groups most similar to French Canadians are Northern European (4.3%, a difference of 0.25%), Immigrants from Northern Europe (4.2%, a difference of 0.28%), Belgian (4.2%, a difference of 0.41%), Scottish (4.3%, a difference of 0.41%), and Iranian (4.2%, a difference of 0.53%).
| Demographics | Rating | Rank | Married-Couple Family Poverty |
| Irish | 99.9 /100 | #33 | Exceptional 4.2% |
| Dutch | 99.9 /100 | #34 | Exceptional 4.2% |
| Europeans | 99.9 /100 | #35 | Exceptional 4.2% |
| English | 99.9 /100 | #36 | Exceptional 4.2% |
| Iranians | 99.9 /100 | #37 | Exceptional 4.2% |
| Belgians | 99.9 /100 | #38 | Exceptional 4.2% |
| Immigrants | Northern Europe | 99.8 /100 | #39 | Exceptional 4.2% |
| French Canadians | 99.8 /100 | #40 | Exceptional 4.2% |
| Northern Europeans | 99.8 /100 | #41 | Exceptional 4.3% |
| Scottish | 99.8 /100 | #42 | Exceptional 4.3% |
| Swiss | 99.8 /100 | #43 | Exceptional 4.3% |
| Immigrants | Japan | 99.8 /100 | #44 | Exceptional 4.3% |
| Serbians | 99.8 /100 | #45 | Exceptional 4.3% |
| British | 99.8 /100 | #46 | Exceptional 4.3% |
| Immigrants | South Central Asia | 99.8 /100 | #47 | Exceptional 4.3% |